In a world where rising energy costs can break the bank, it’s no wonder that the number of U.S. households installing solar panels is increasing by 32% every year.
Significant savings act as a primary motivator. Of those Americans who have either adopted or contemplated installing solar panels, 91% cite the allure of potential reductions in utility bills. This proves to be a wise decision. Based on our calculations, the average solar system owner can save approximately $1,432 per year on their energy bills.
Depending on the local policies regarding net metering, homeowners also have the option to sell excess energy back to the grid in exchange for credits on their power bills. However, despite the financial advantages, the initial expenses associated with installing solar panels can extend into the tens of thousands of dollars.
Recognizing these potential benefits, it becomes evident to consider a solar-powered home when searching for a property. But how does the market for such homes differ across the country? And in which areas do home buyers need to allocate more funds for a property equipped with solar capabilities?
To address these questions, The MarketWatch Guides team delved into Zillow home listings, gathering data on the total number of properties for sale that included the keyword "solar." This information allowed us to determine the prevalence of solar home listings in specific states and cities relative to the local population. By examining each listing's page views and price details, we calculated the median views per day and assessed how much additional investment a homebuyer might need to make for a solar-powered home compared to the average home in each city and state.
Key Findings
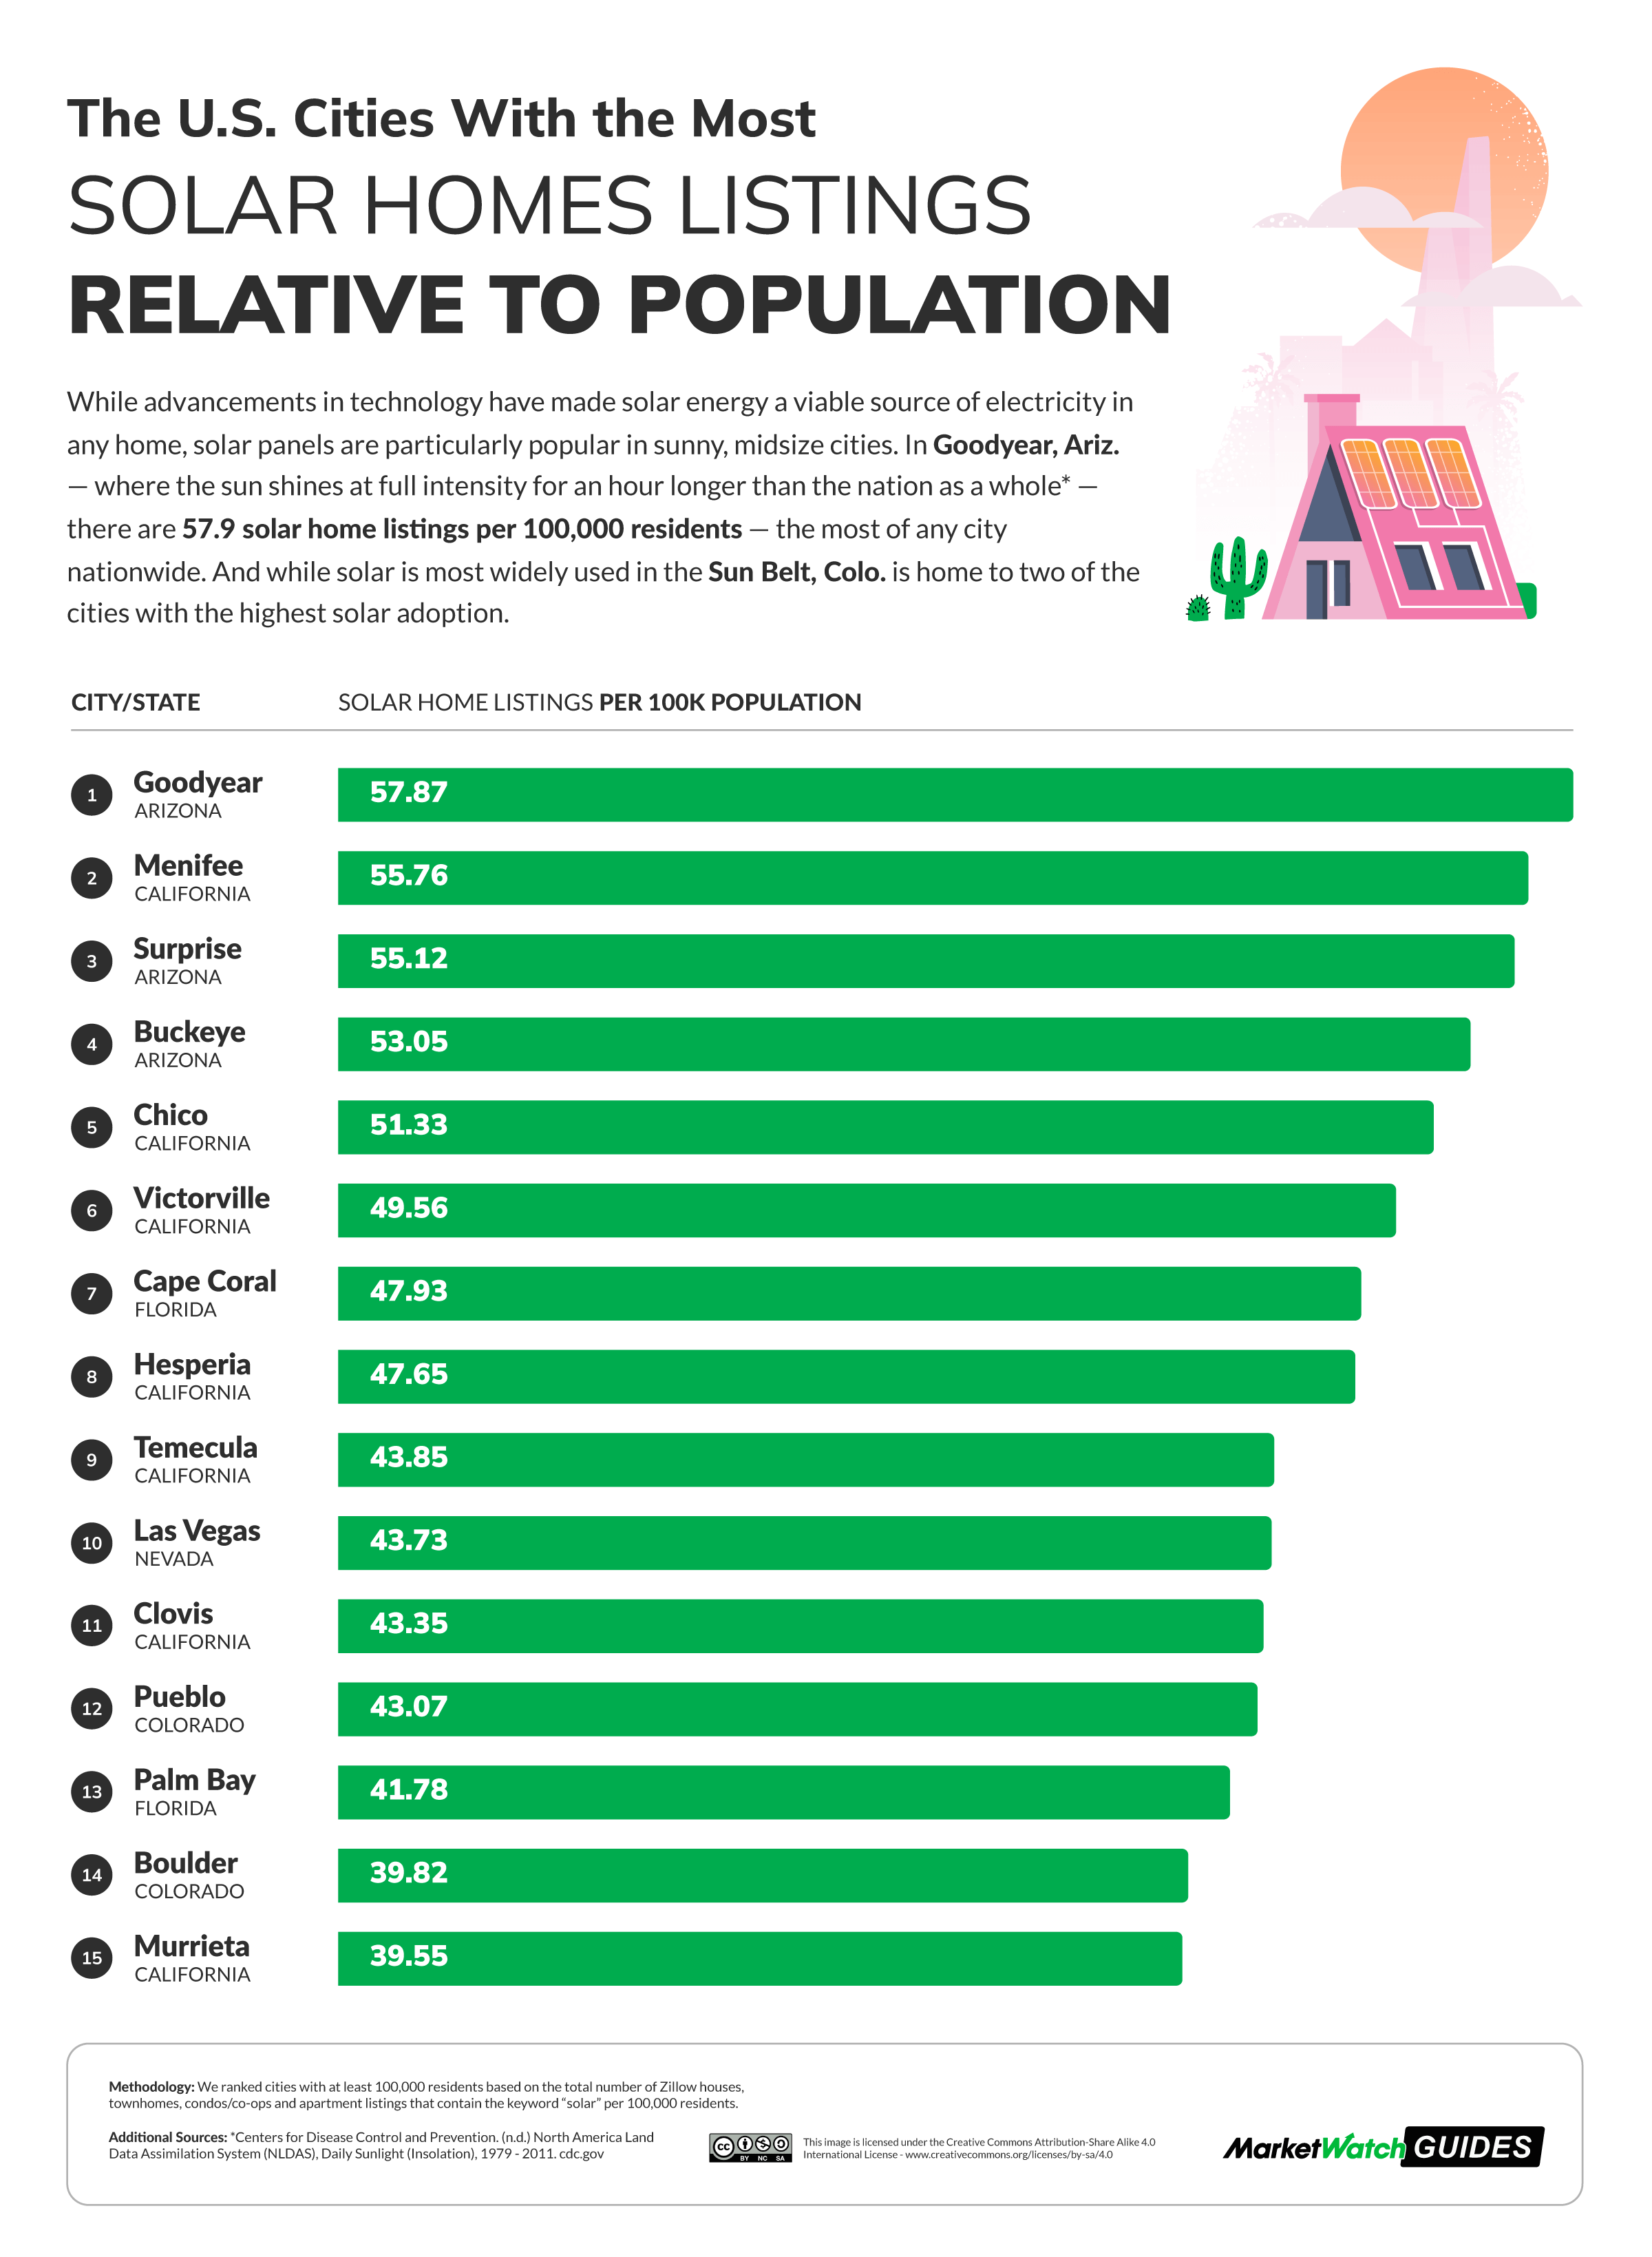
- On Zillow, Las Vegas boasts the highest number of solar-powered homes for sale (287) among all U.S. cities. Nevertheless, Goodyear, Ariz., takes the lead with the highest proportion of homes with installed solar for sale (57.87) per 100,000 of the population.
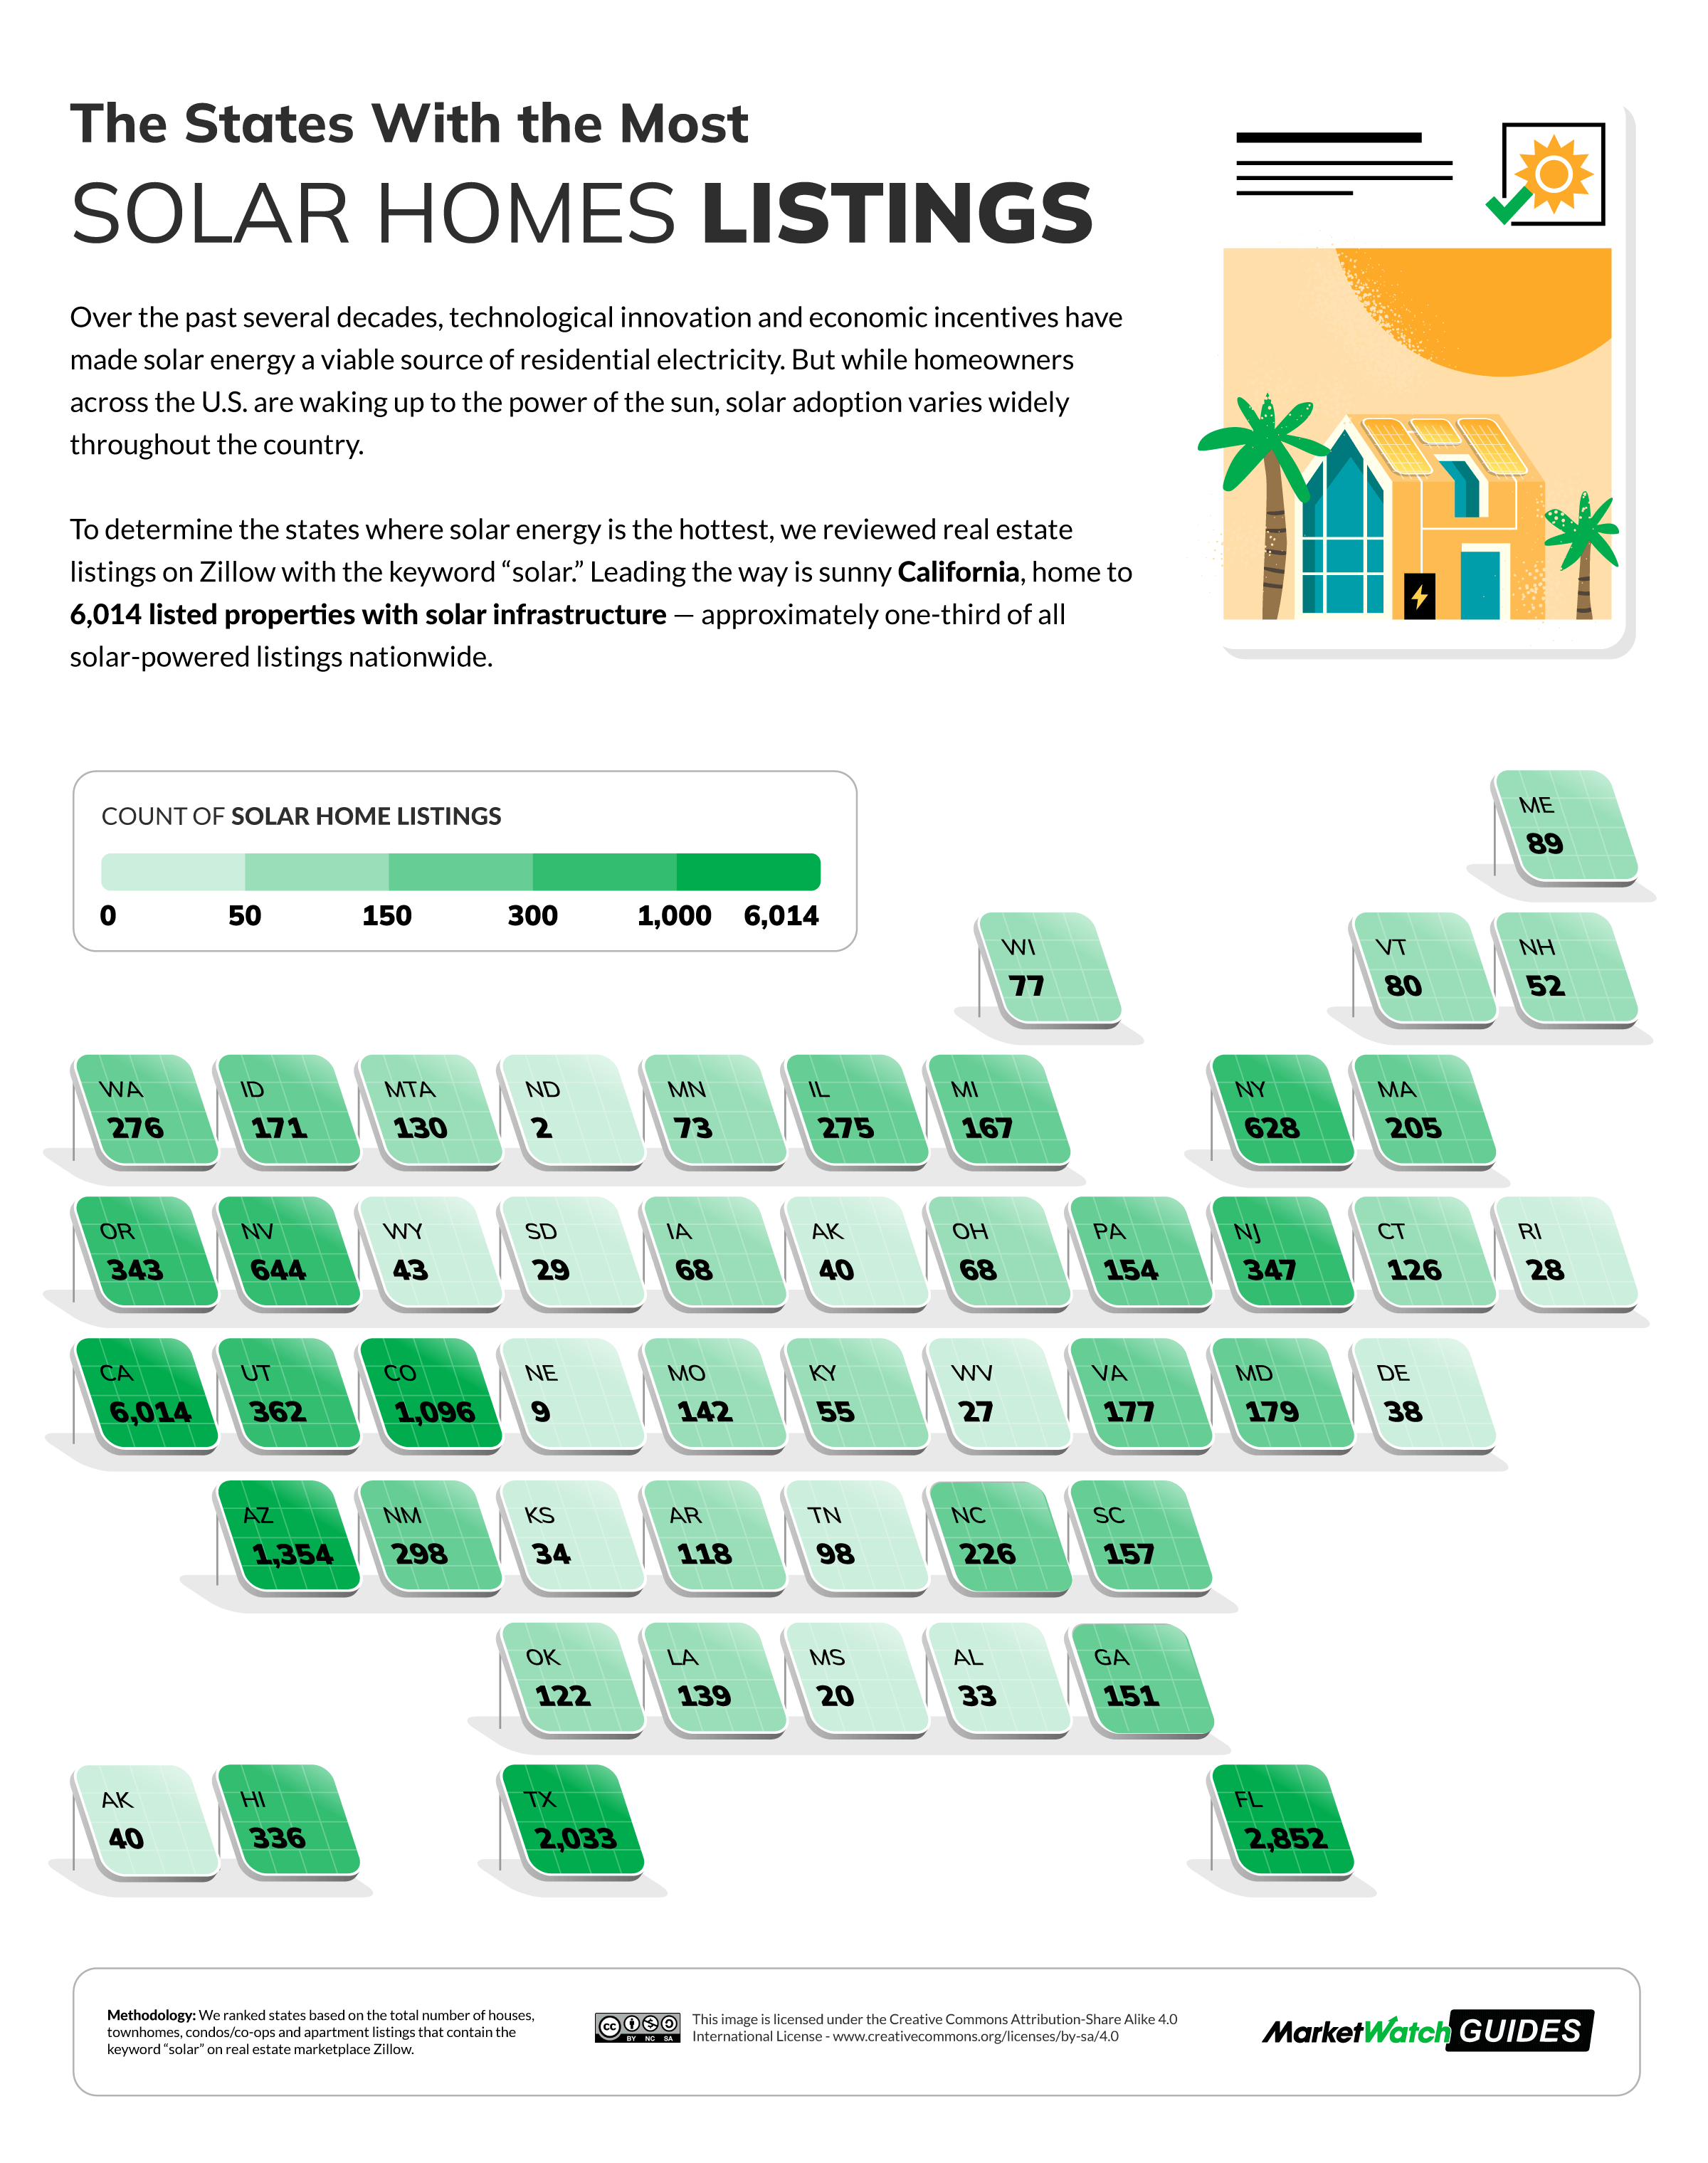
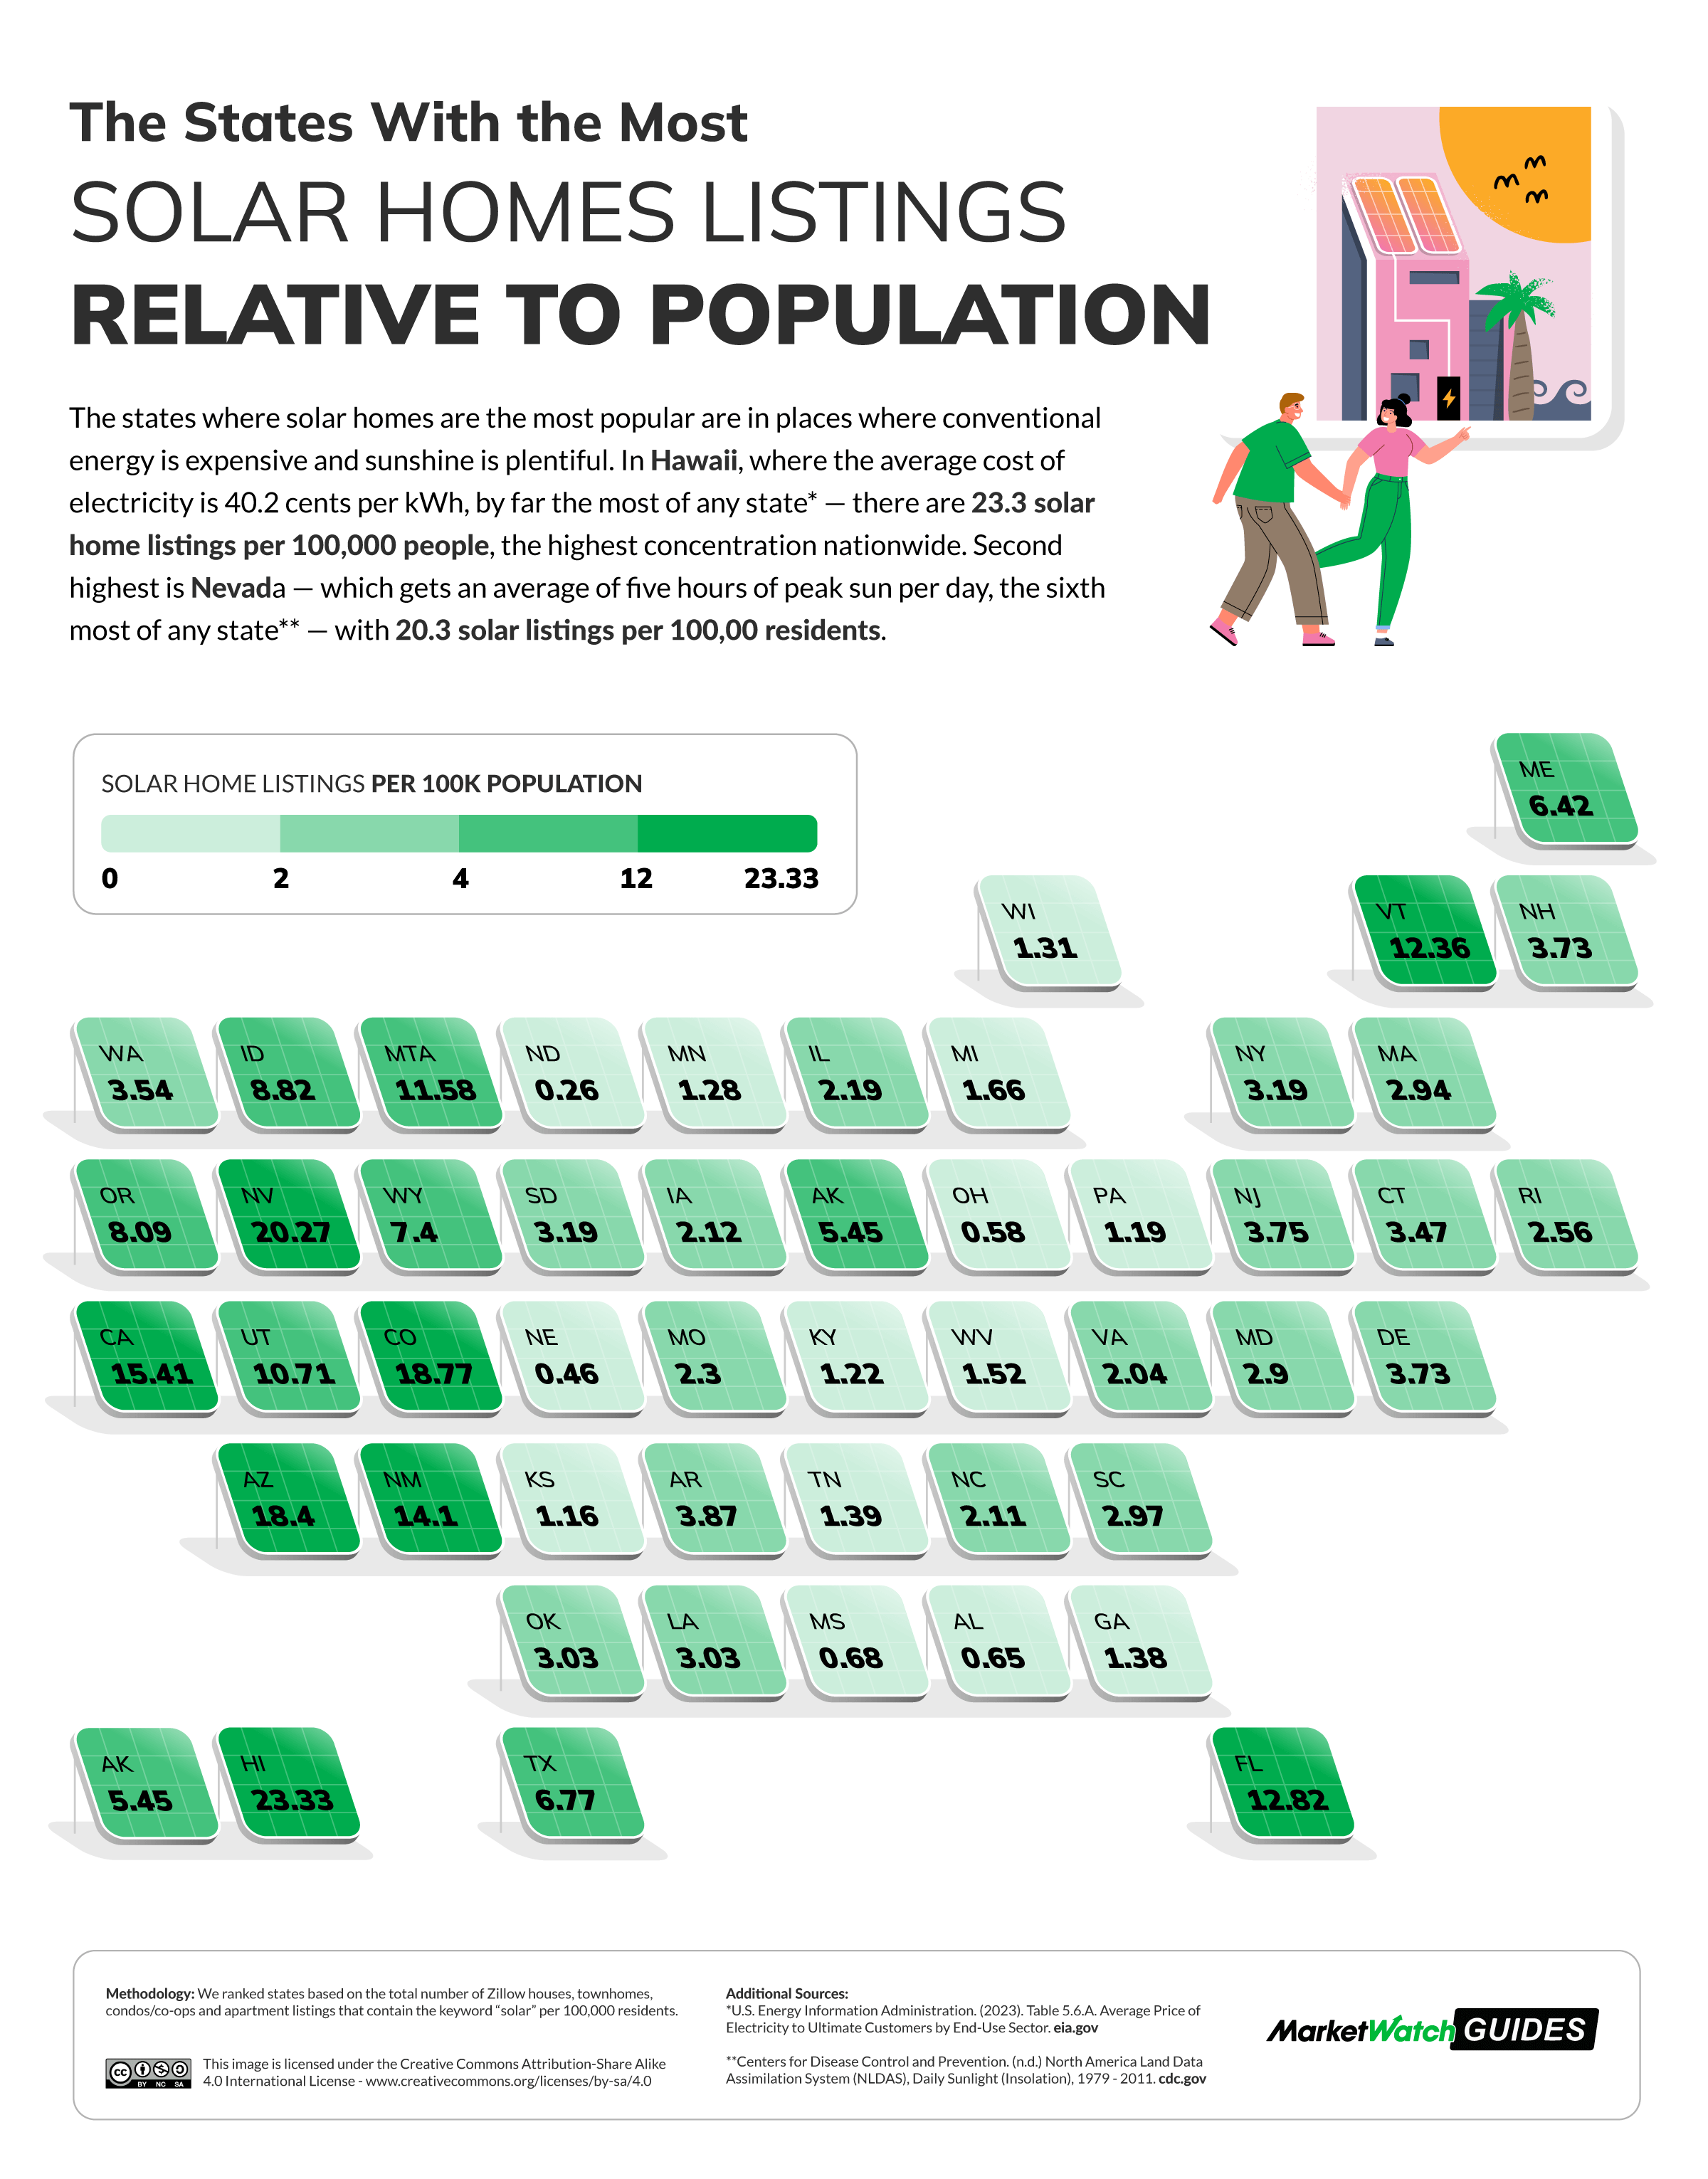
- On a state level, California (6,014) and Florida (2,852) emerge with the most solar-powered homes available, while Hawaii (23.33) and Nevada (20.27) exhibit the highest numbers per 100,000 residents.
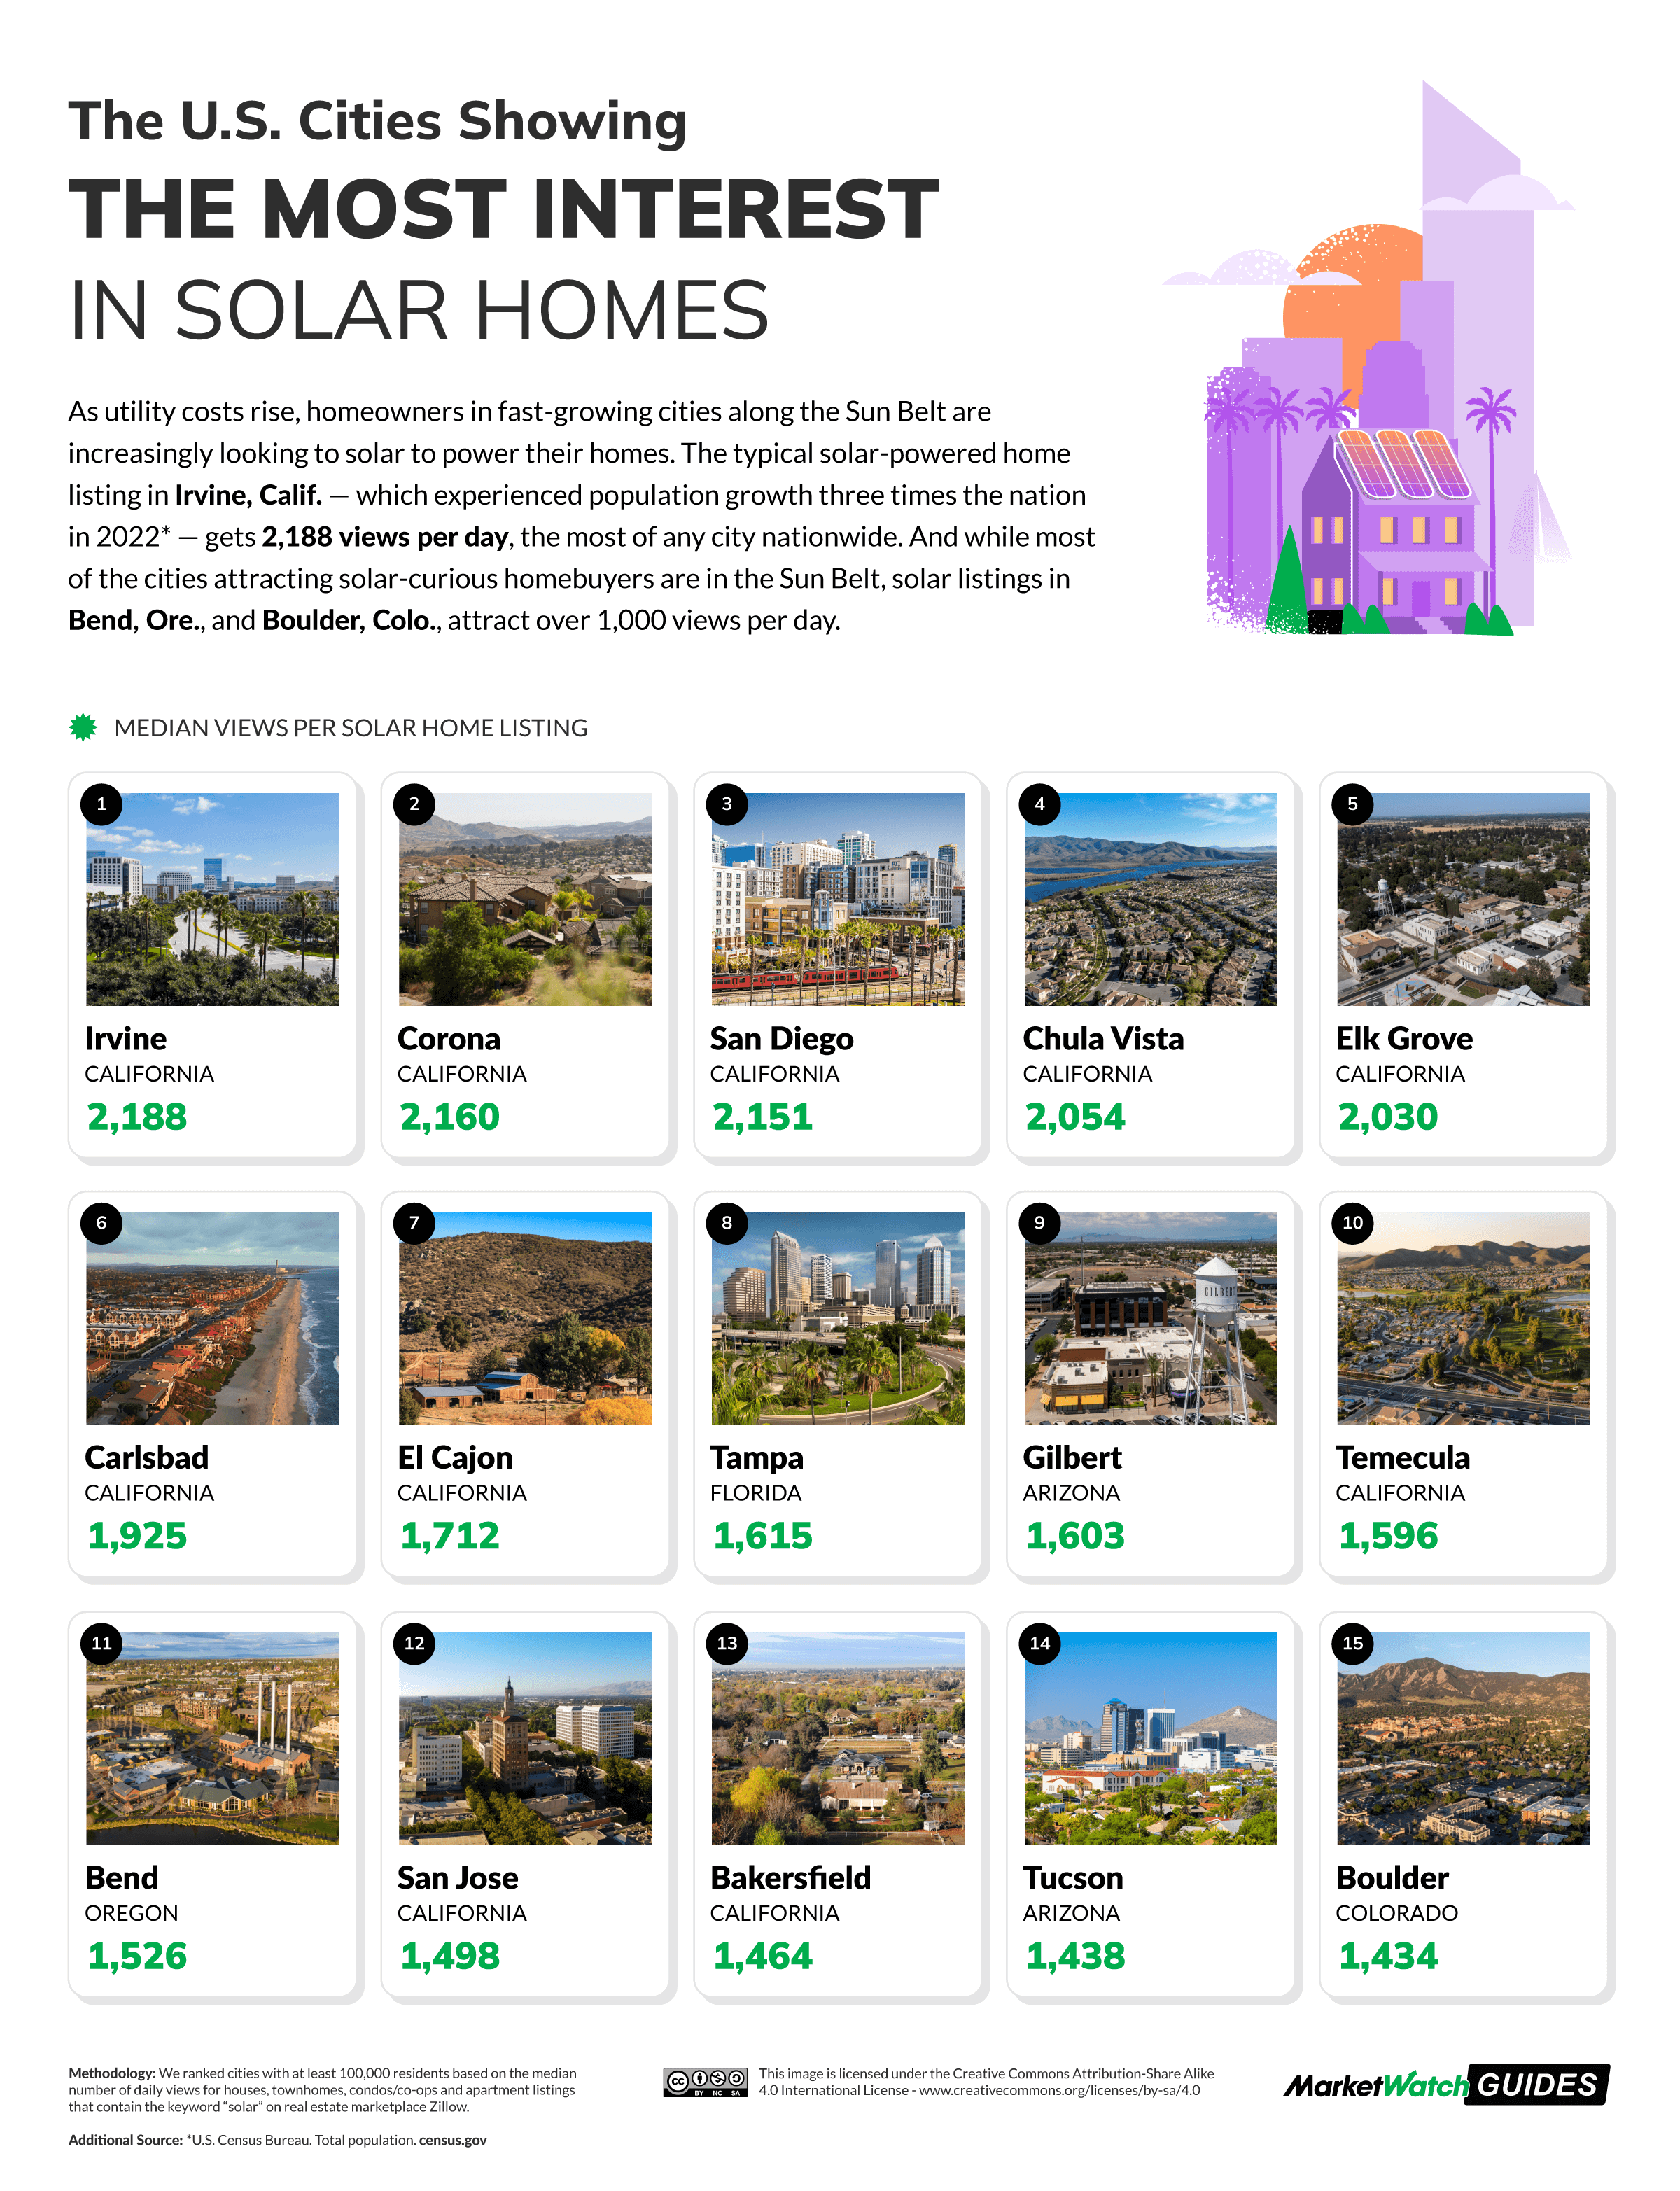
- In terms of popularity, a typical solar home listing in Irvine, Calif., garners the highest daily views at 2,188, surpassing all other U.S. cities. Conversely, New Hampshire claims the spotlight at the state level, with its solar homes attracting the most views (1,799).
- When it comes to pricing, solar-powered homes in Arkansas command the highest premium at 91.15% compared to a typical local home — the steepest premium among all states. In contrast, California boasts the lowest price premium at 4.13%.
The U.S. Cities With the Most Solar Homes Listings
In the United States, if you're looking for a location with the highest number of solar-powered homes for sale, our search began by scrutinizing Zillow listings in various cities. The analysis revealed that Las Vegas takes the lead, with an impressive 287 solar homes currently available on the market. It's worth noting that a portion of these listings may be associated with the growing trend of
entirely solar-powered developments in and around the city, such as a
luxury community featuring 51 homes, each equipped with rooftop panel systems.
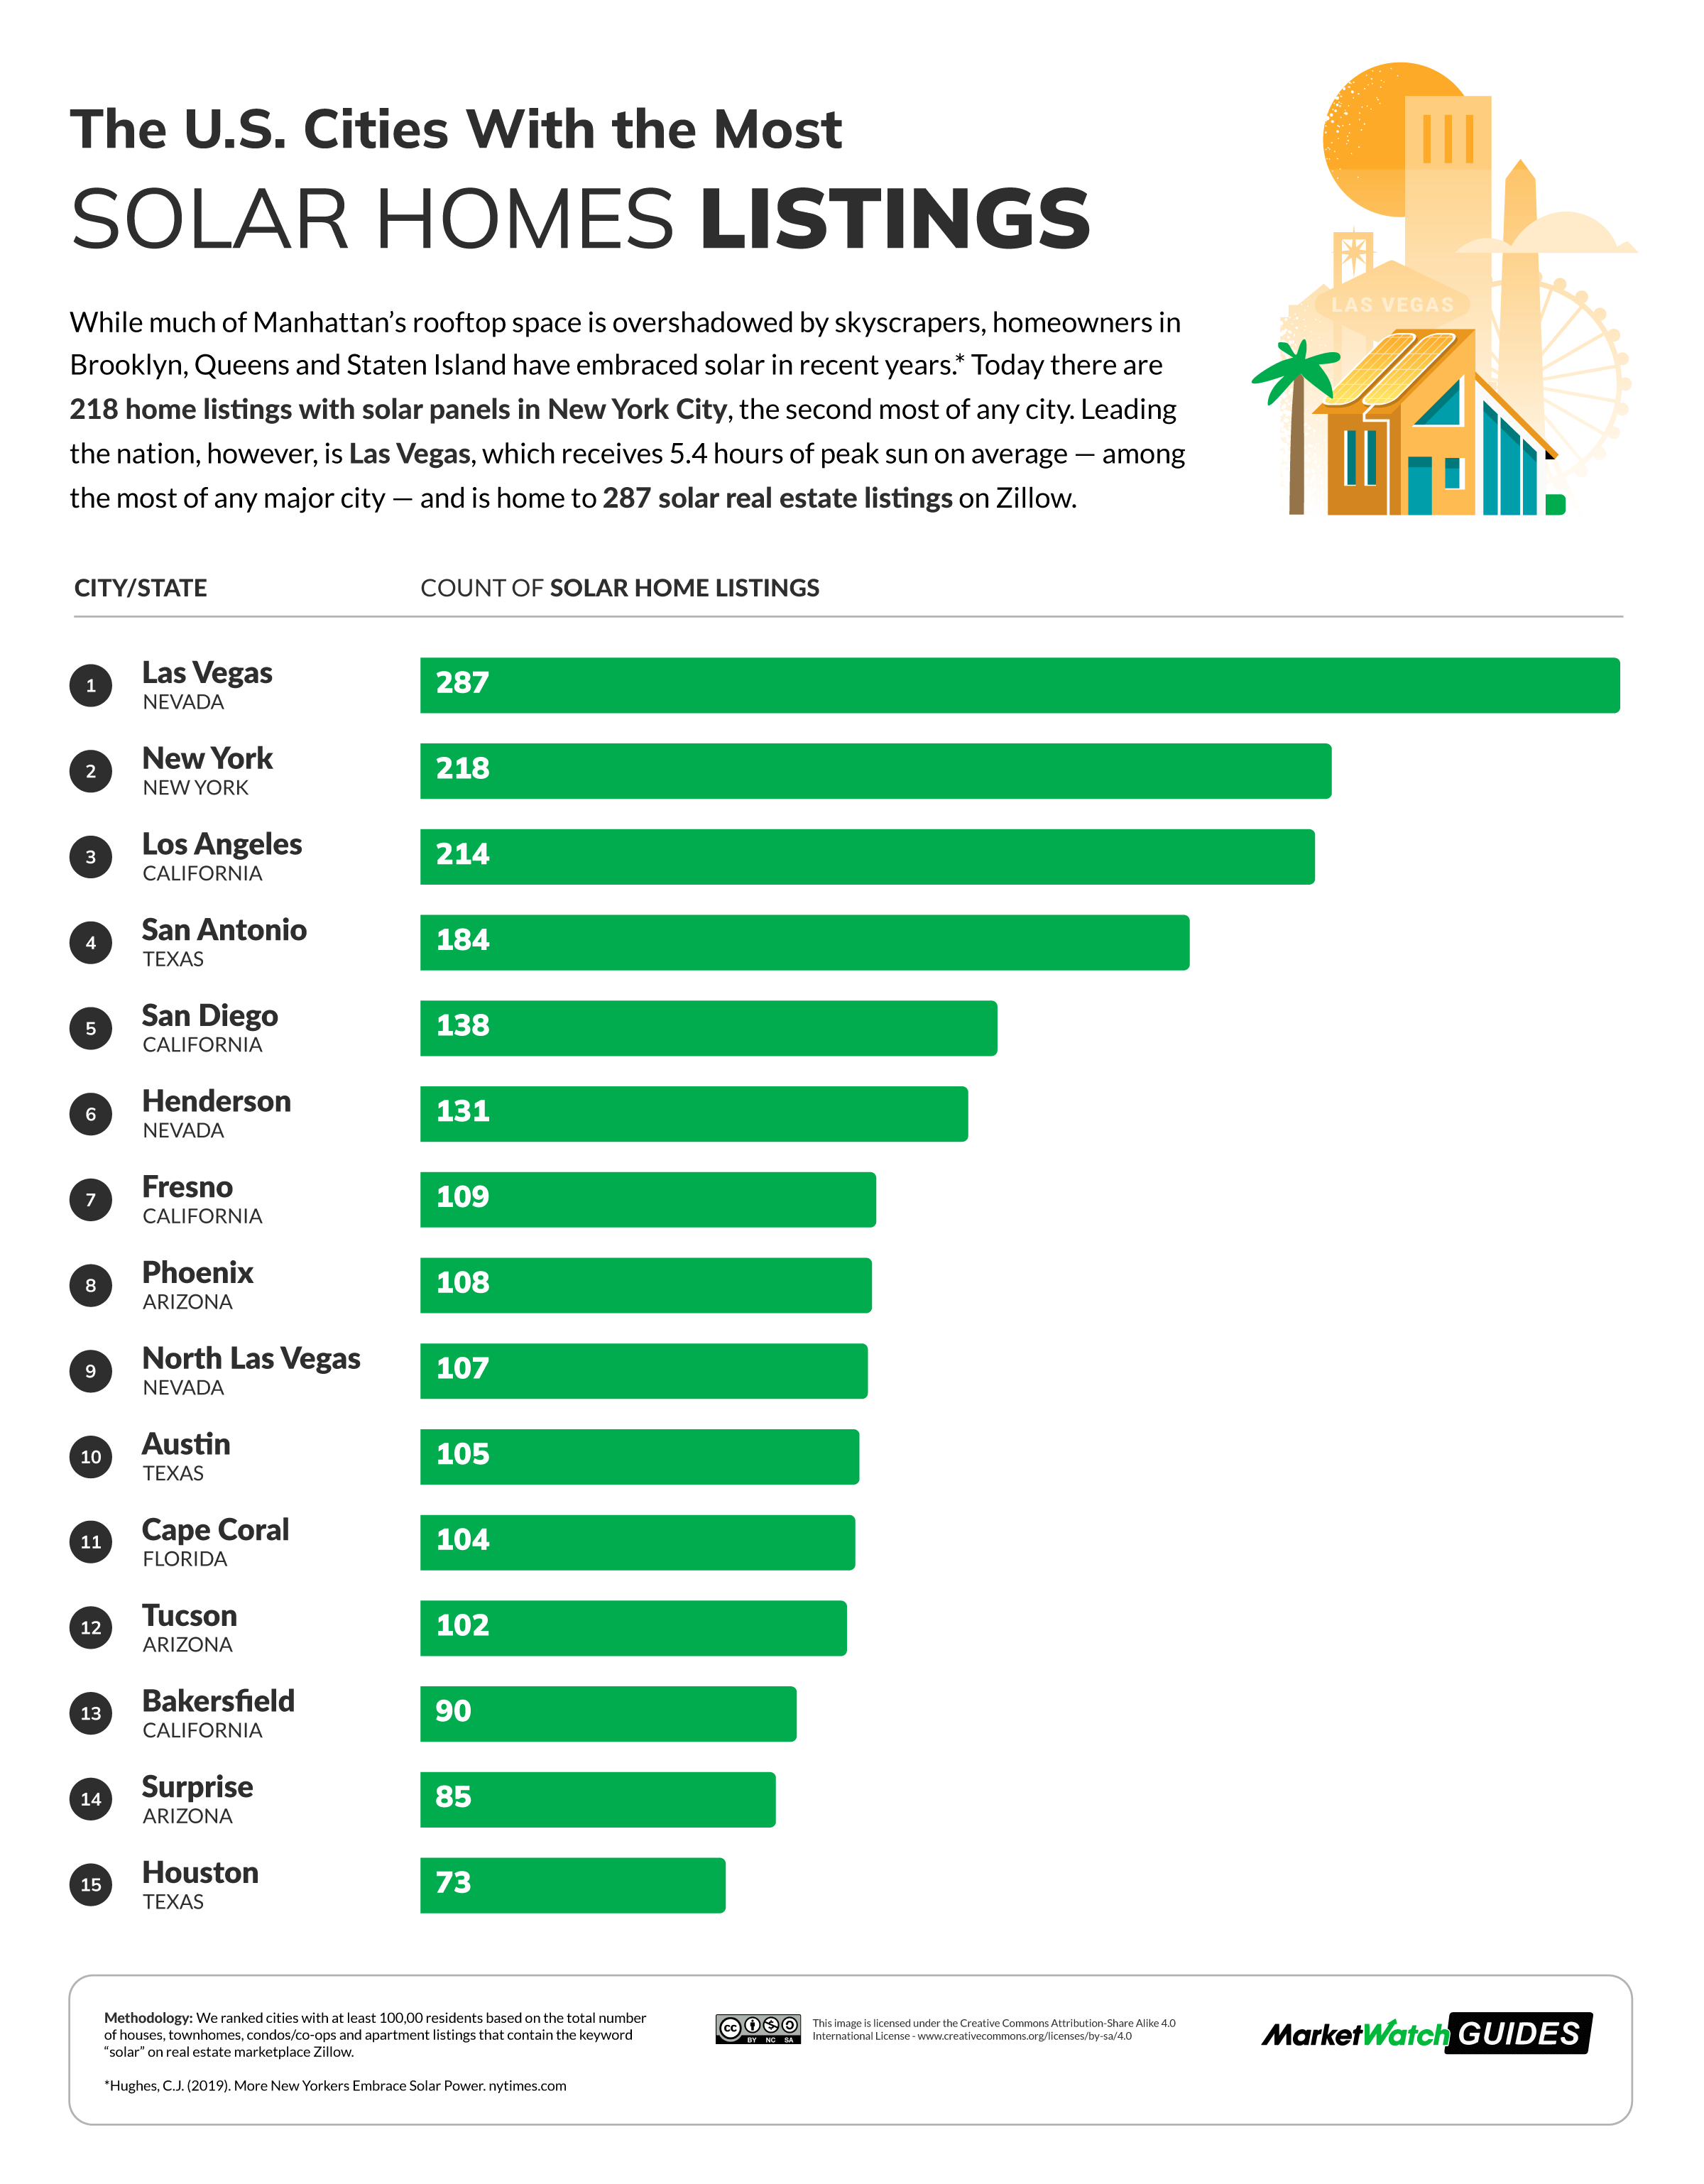
Securing the second spot, New York boasts 218 solar-powered homes currently listed for sale. This trend isn't limited to the state itself; even the boroughs of New York City have experienced a
notable increase in solar power installations as residents seek more economical energy solutions and embrace eco-friendly living practices. Furthermore, newly constructed apartments available for sale are increasingly likely to feature solar power, a shift attributed to local regulations mandating "
solar or green roofs" on all new developments.
The U.S. Cities With the Most Solar Homes Listings Relative to Population
In Goodyear, Arizona, the MarketWatch team discovered an impressive 57.87 solar-powered home listings per 100,000 residents — a figure surpassing all other cities in the country. Securing the top position in the ranking, which encompasses two other relatively
populous Arizona cities, Goodyear benefits from
over 300 days of sunshine annually, making it an ideal locale for the implementation of solar power systems.
Leading the rankings are cities in California and Florida, with notable contributions from Menifee (55.76 listings per 100,000 people) and Cape Coral (47.93 listings). Two cities in Colorado, which are not typically considered part of the
Sun Belt, contradict the trend.
Pueblo (43.07 listings) and
Boulder (39.82 listings) have both set goals to increase renewable energy generation by the 2030s.
The States With the Most Solar Homes Listings
Moving on, the MarketWatch team charted the states boasting the highest number of solar-powered homes for sale, and California emerged as the leader with a total of 6,014 listings. This finding aligns with expectations, given that California has the
highest concentration of solar-powered homes among all U.S. states. Following closely is Florida, with 2,852 listings, securing its position as the state with the third-highest count of solar-powered homes in the nation.
Nevertheless, when considering the population, Hawaii stands out with the highest concentration of solar-powered homes on the market, boasting 23.33 listings per 100,000 people. This is particularly notable given the high cost of traditional energy in the state, where the average resident pays
43.18 cents per kilowatt-hour (kWh) of electricity — the highest rate among all U.S. states.
The States With the Most Solar Homes Listings Relative to Population
Following closely is Nevada, with 20.27 solar-powered home listings per 100,000 people. In Nevada, the average resident contends with an electricity rate of 17.59 cents per kilowatt-hour (kWh). Renowned as one of the premier locations in the country for solar adoption, Nevada ranks as the
third-sunniest U.S. state based on annual hours of sunlight received. Furthermore, the state's energy provider, NV Energy, has expanded a solar farm by
7,000 acres this year, contributing to their efforts to achieve renewable energy goals set for 2030.
The U.S. Cities Showing The Most Interest in Solar Homes
An average solar-powered home listing in Irvine, California, garners an impressive 2,188 views per day — surpassing all other cities in the nation. Given the
substantial population growth experienced by the city, it's plausible that newcomers are actively exploring homes that offer the cost-saving advantages associated with solar power panels.
Nine additional cities in California also secure notable rankings, with San Diego, for instance, accumulating 2,151 views. The inclusion of solar power as a must-have feature on property wish lists for home seekers in the state comes as no surprise. Solar power not only capitalizes on
California's abundant sunshine but also serves as a viable alternative to combat high electricity bills. The average resident in California spends o
ver $3,000 annually on energy bills, which is 35% higher than the national average.
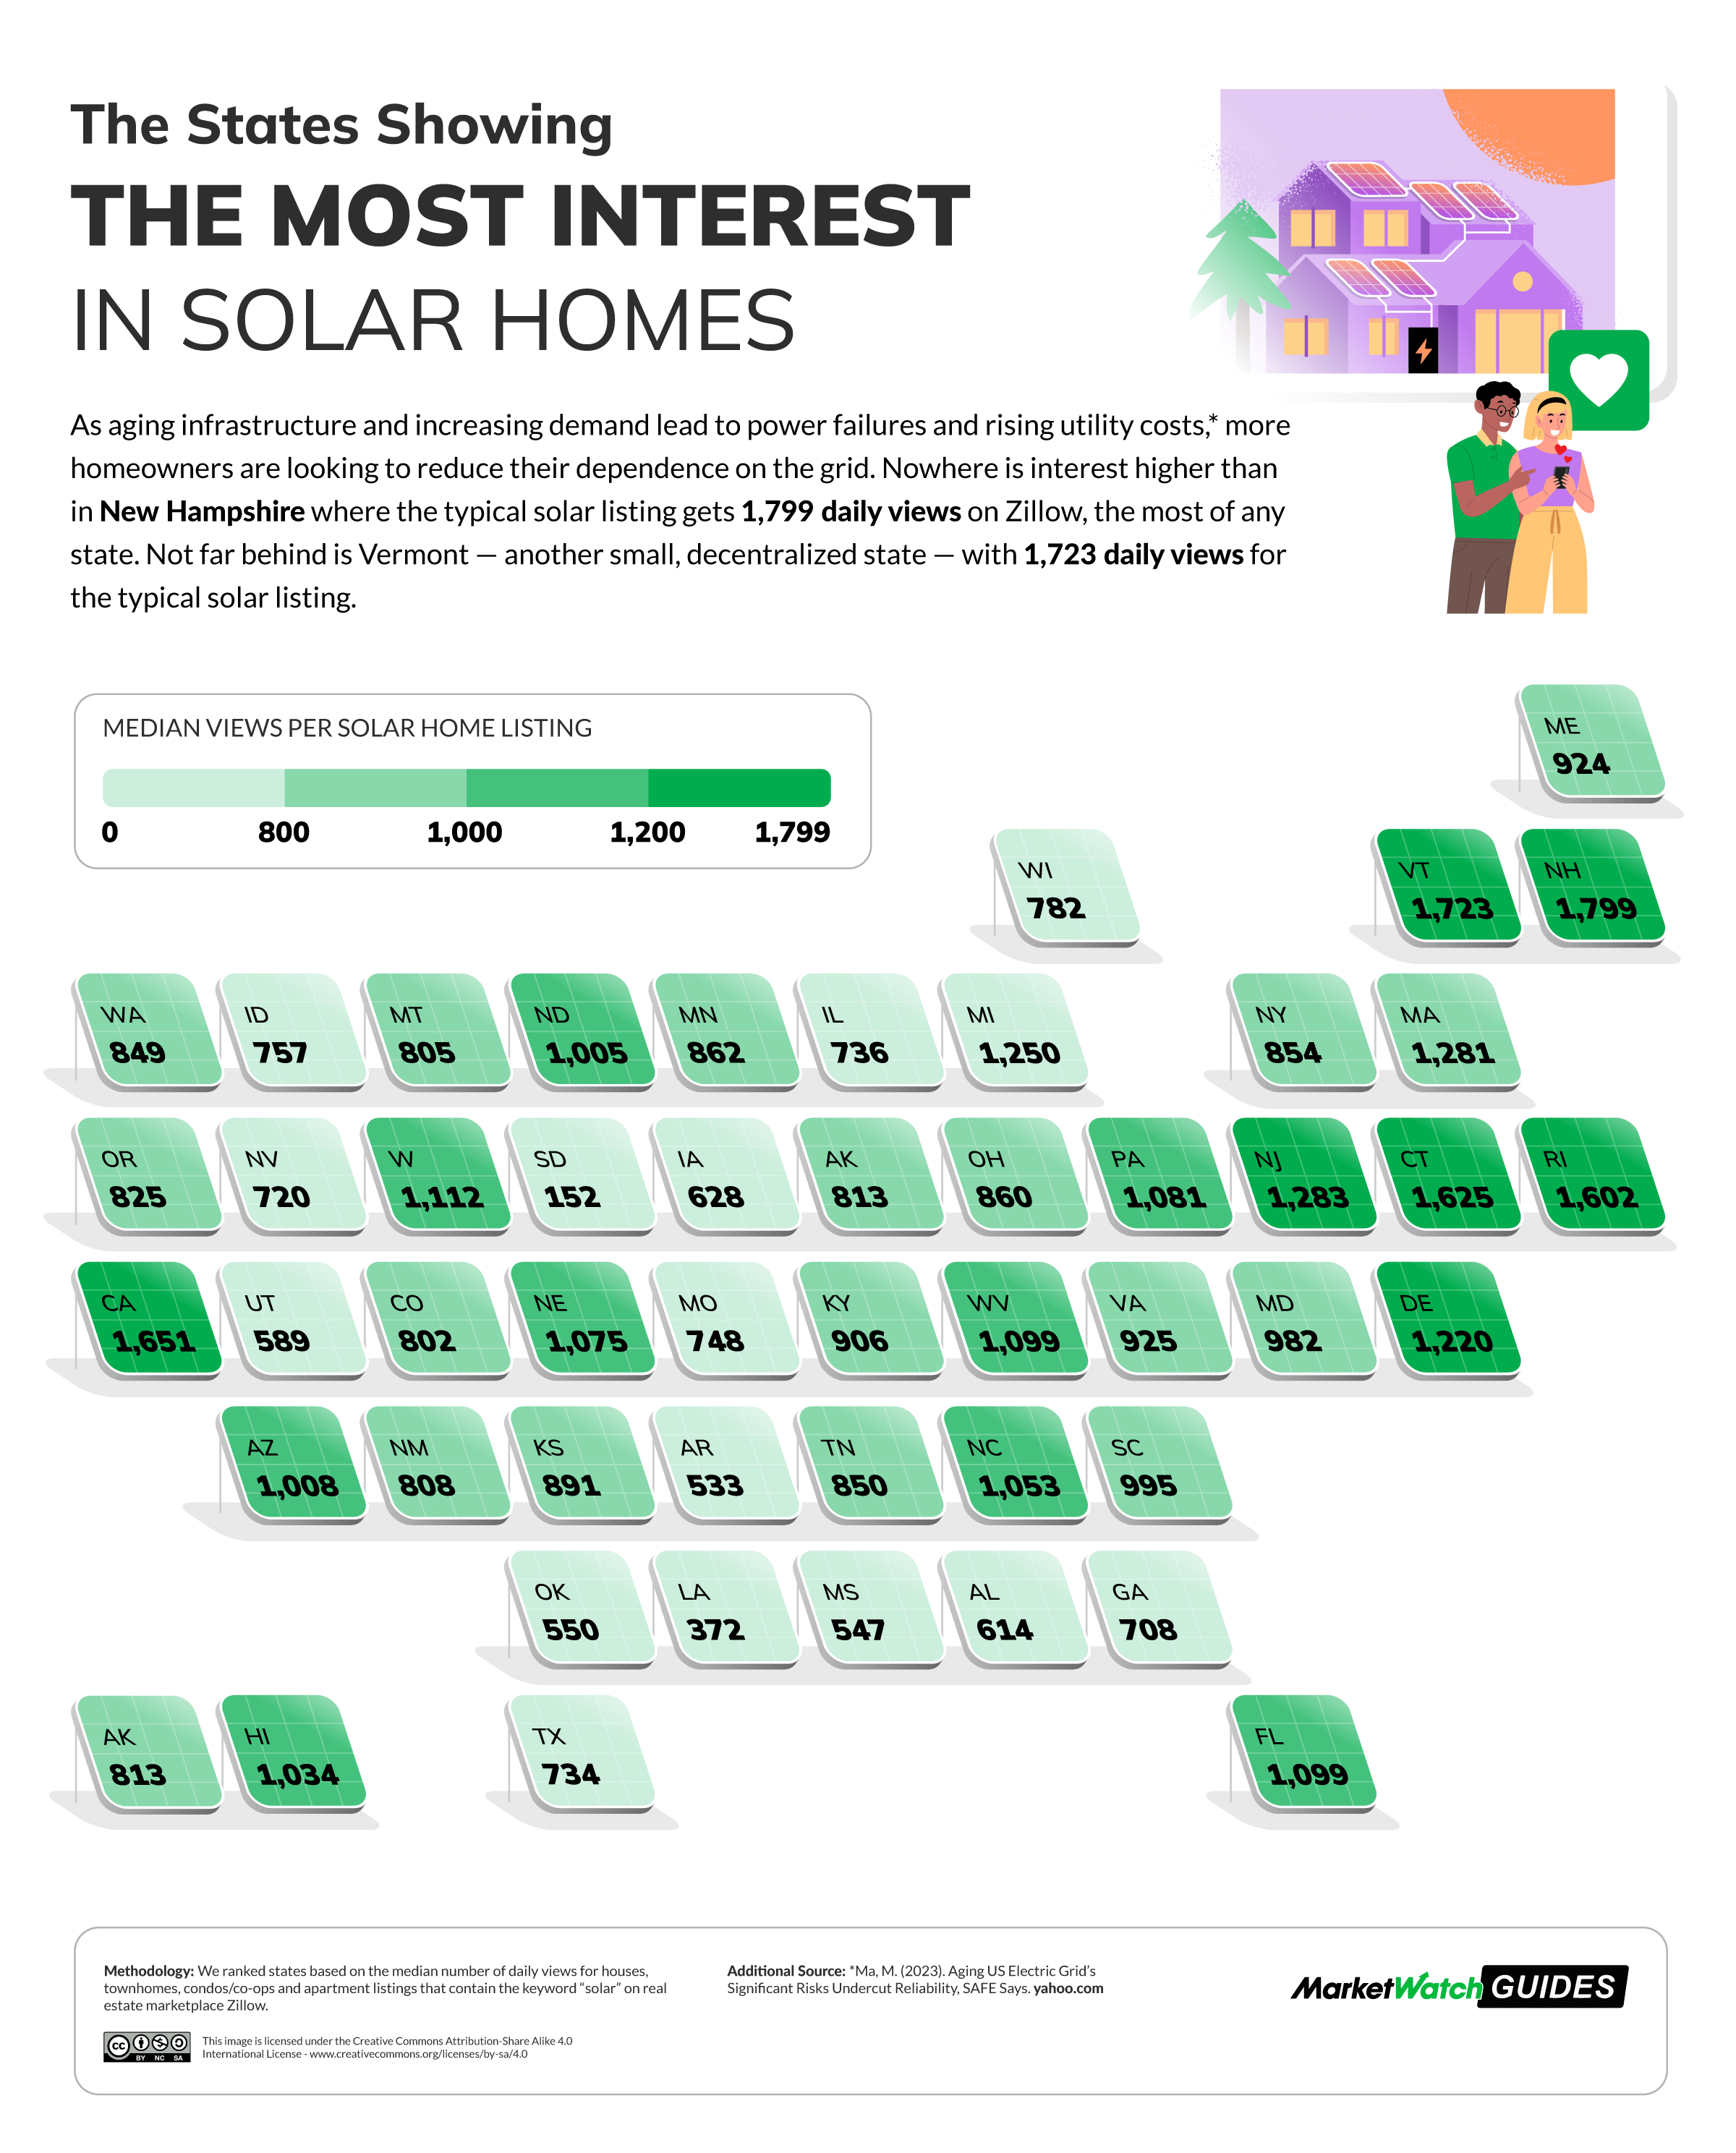
Shifting our focus to states, the accompanying map below illustrates the median number of daily views that a typical solar-powered home listing attracts in each state.
The States Showing The Most Interest in Solar Homes
Solar-powered homes in New Hampshire lead in daily views on Zillow, garnering 1,799 views. Notably, over
two-fifths of households in the state rely primarily on fuel oil for home power, marking the second-largest share among all states. With the possibility of fuel reserves
running low, homebuyers in New Hampshire may be inclined to transition to renewable energy sources.
Arkansas takes the spotlight for having the highest premium, with solar-powered homes being 91% more expensive than the average home — the highest among all states.
The
Solar Energy Industries Association (SEIA) estimates the cost of installing a residential solar system to be upwards of $25,000. The MarketWatch Guides team's survey places the price between $15,000 and $20,000 for an 8-kilowatt (kW) system. Given these costs, it's evident that the average homeowner would need to invest tens of thousands of dollars to install a solar power system, making a property with pre-installed solar panels an appealing purchase.
Now, in comparison to the median cost of local homes, where in the country are homebuyers paying the highest and lowest premiums for a solar home?
The States With The Highest and Lowest Price Premiums for Solar Homes
In Arkansas, homebuyers face the highest premium, needing to invest 91.15% more than the standard price to purchase a solar-powered home. This elevated premium in Arkansas may stem from the state offering fewer solar incentives compared to others, potentially resulting in a limited availability of solar-powered homes. Furthermore, recent legislation passed in 2023 is set to curtail the number of net metering credits that solar-powered homes in Arkansas can receive for surplus energy fed back into the electric grid.
On the opposite end of the spectrum, California boasts the lowest premium at 4.13%. As the state with the most abundant supply of solar-powered homes, it is relatively easier to find such properties on the market, thereby reducing the price premium. Following closely is New Jersey, with a 6.62% price premium. Like California, New Jersey features a substantial number of solar-powered homes and offers numerous incentives for installing personal solar systems.

Methodology
In assessing the interest and availability of solar-powered homes by state, the study involved a comprehensive analysis of real estate listings sourced from the
Zillow marketplace. The MarketWatch team ranked states and cities with a minimum population of 100,000, considering the total number of houses, townhomes, condos or co-ops, and apartment listings that included the keyword "solar."
Population data was also incorporated to determine the number of listings with the keyword "solar" per 100,000 residents at both the city and state levels. Additionally, data on median daily views per listing, obtained from Zillow, played a pivotal role in calculating the price premium for homes with solar compared to those without in each state.
It's important to note that this data analysis is accurate as of November 2023.


This post may contain affiliate links. As an Amazon Associate, I earn from qualifying purchases.
Comments
Post a Comment