Every day, the average adult inhales approximately 11,000 liters of air. While getting outside and breathing in fresh air has numerous health benefits, the reality is that not all air is good for you.
Airborne pollutants are one of the greatest sources of toxic exposure known to humankind and have a significant impact on human health. According to one estimate from the World Health Organization (WHO), air pollution contributes to seven million premature deaths around the world every year.
The dangers of smoking cigarettes are well publicized. But while quitting smoking is a straightforward way to reduce exposure to toxins and improve overall health, it is less easy to avoid exposure to the many toxins that pollute the indoor and outdoor air we breathe every day. Whether you’re a smoker or not.
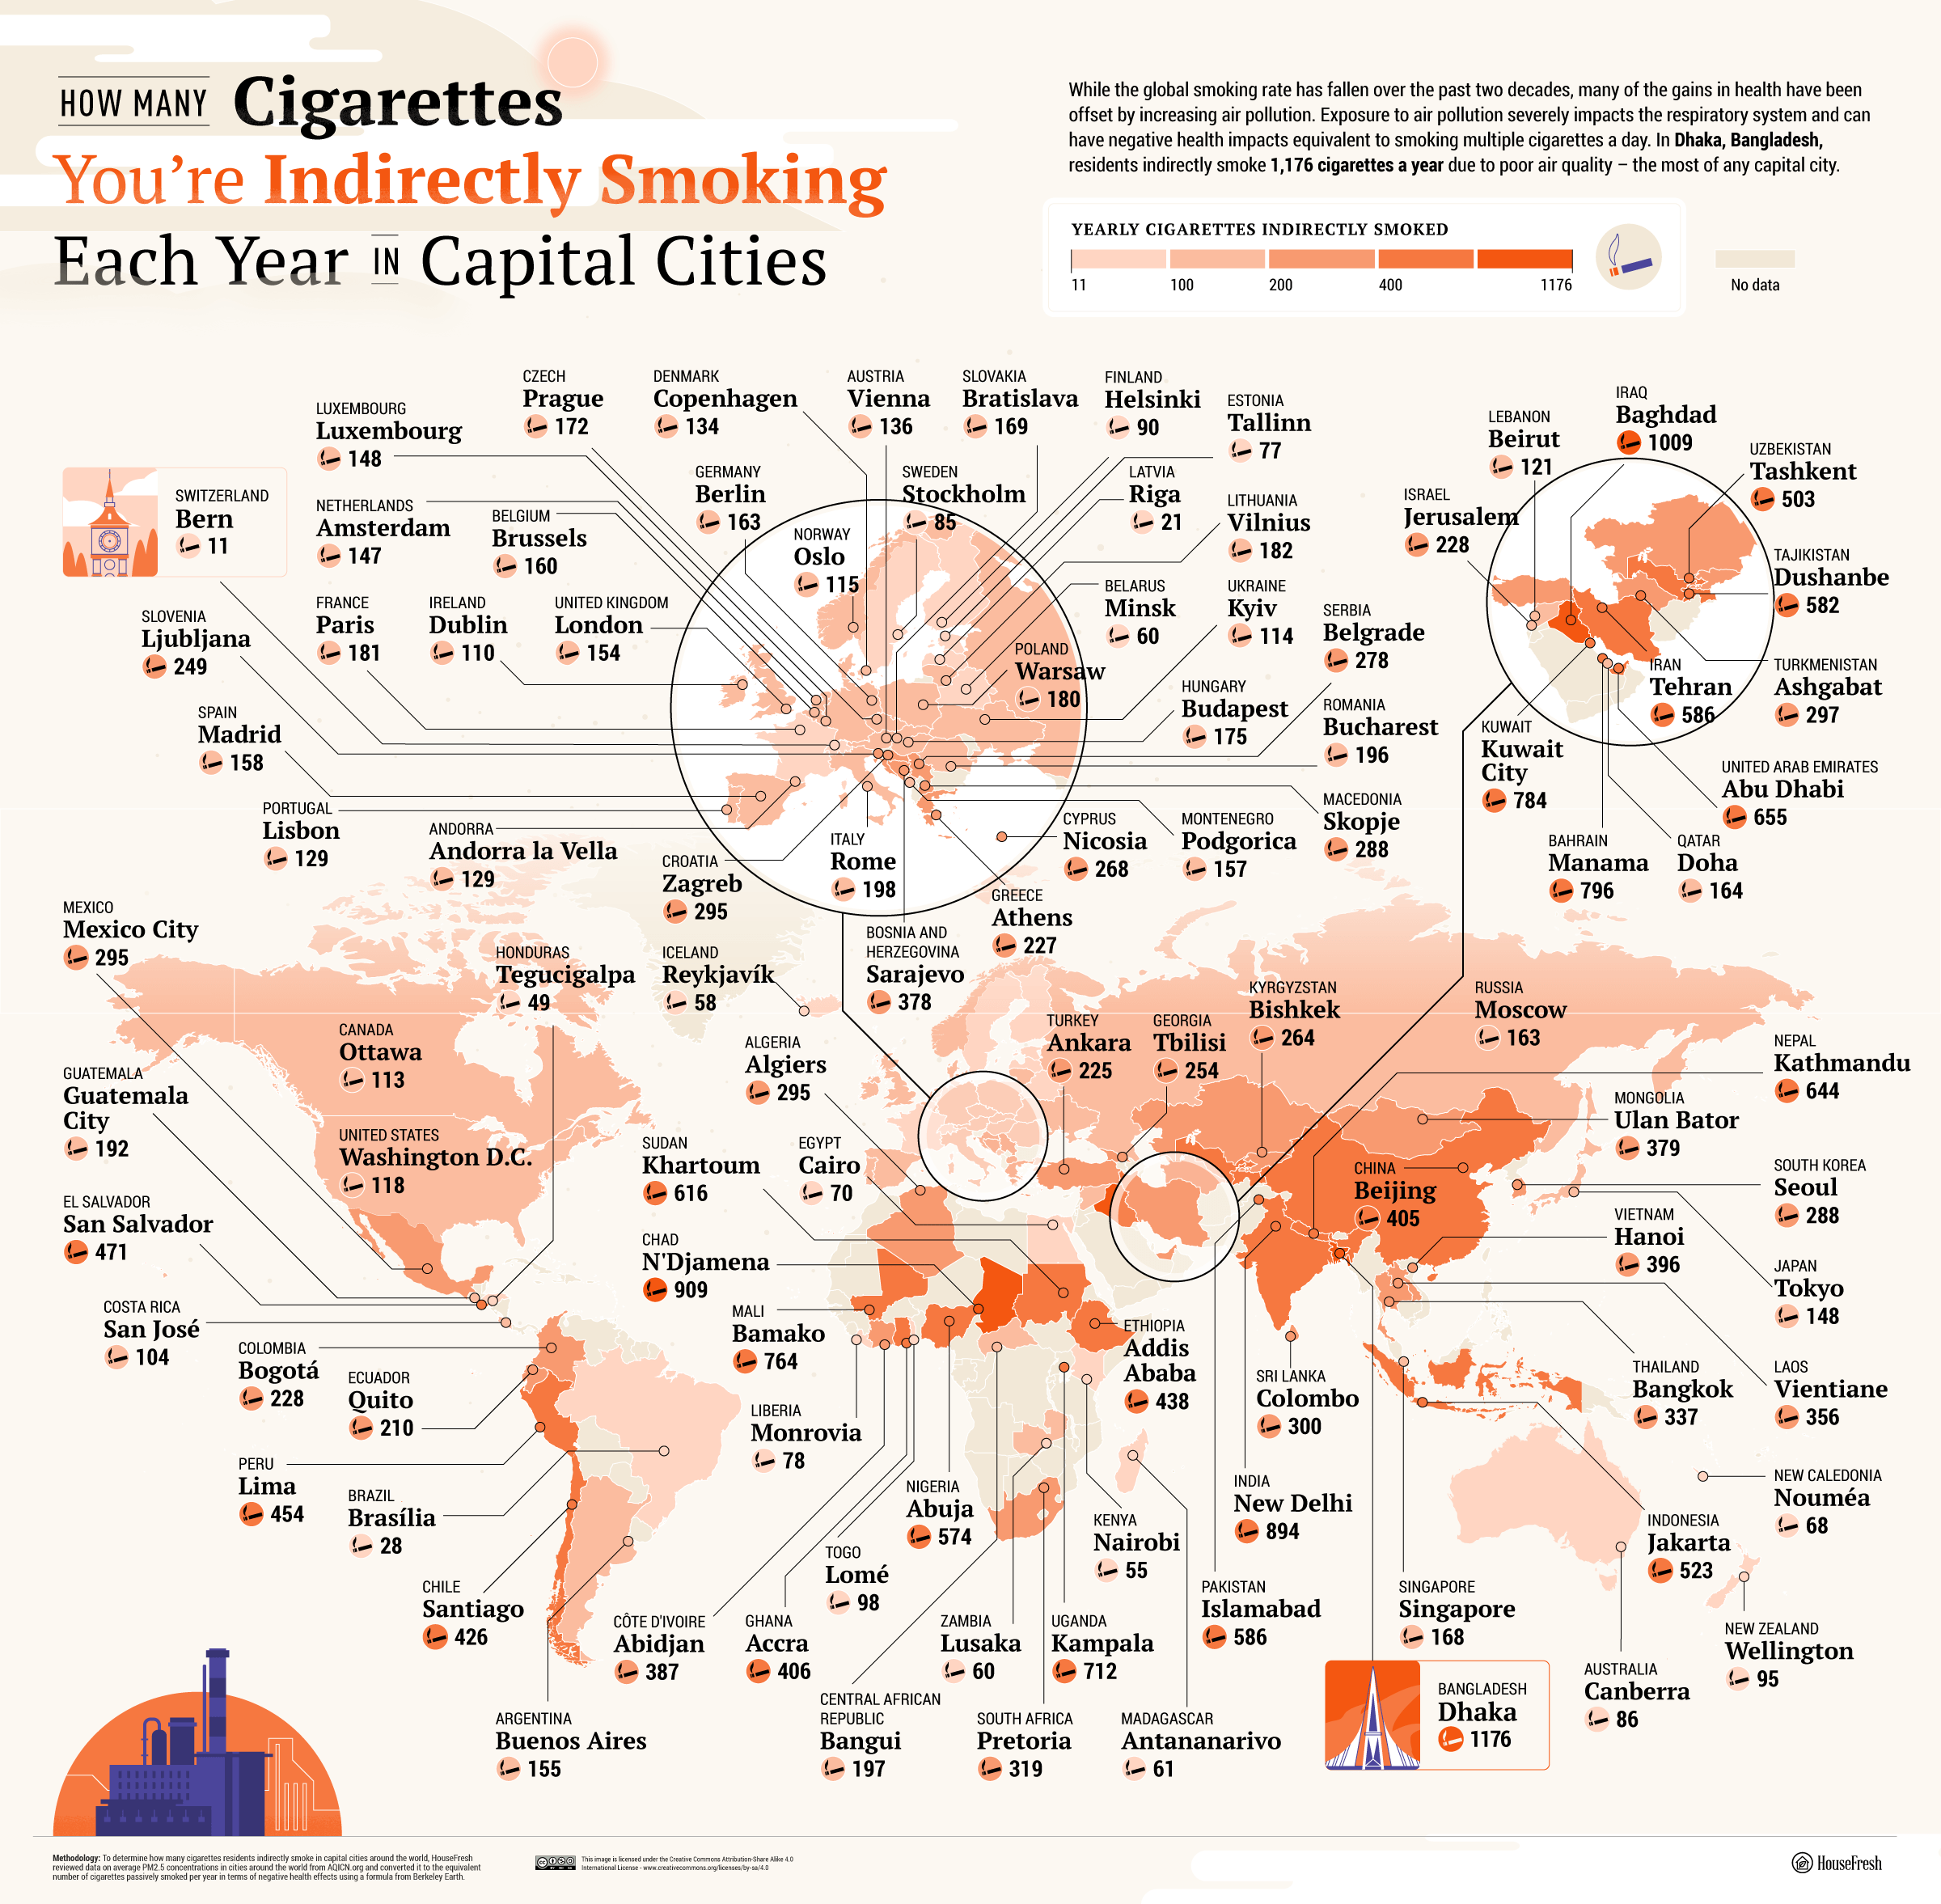
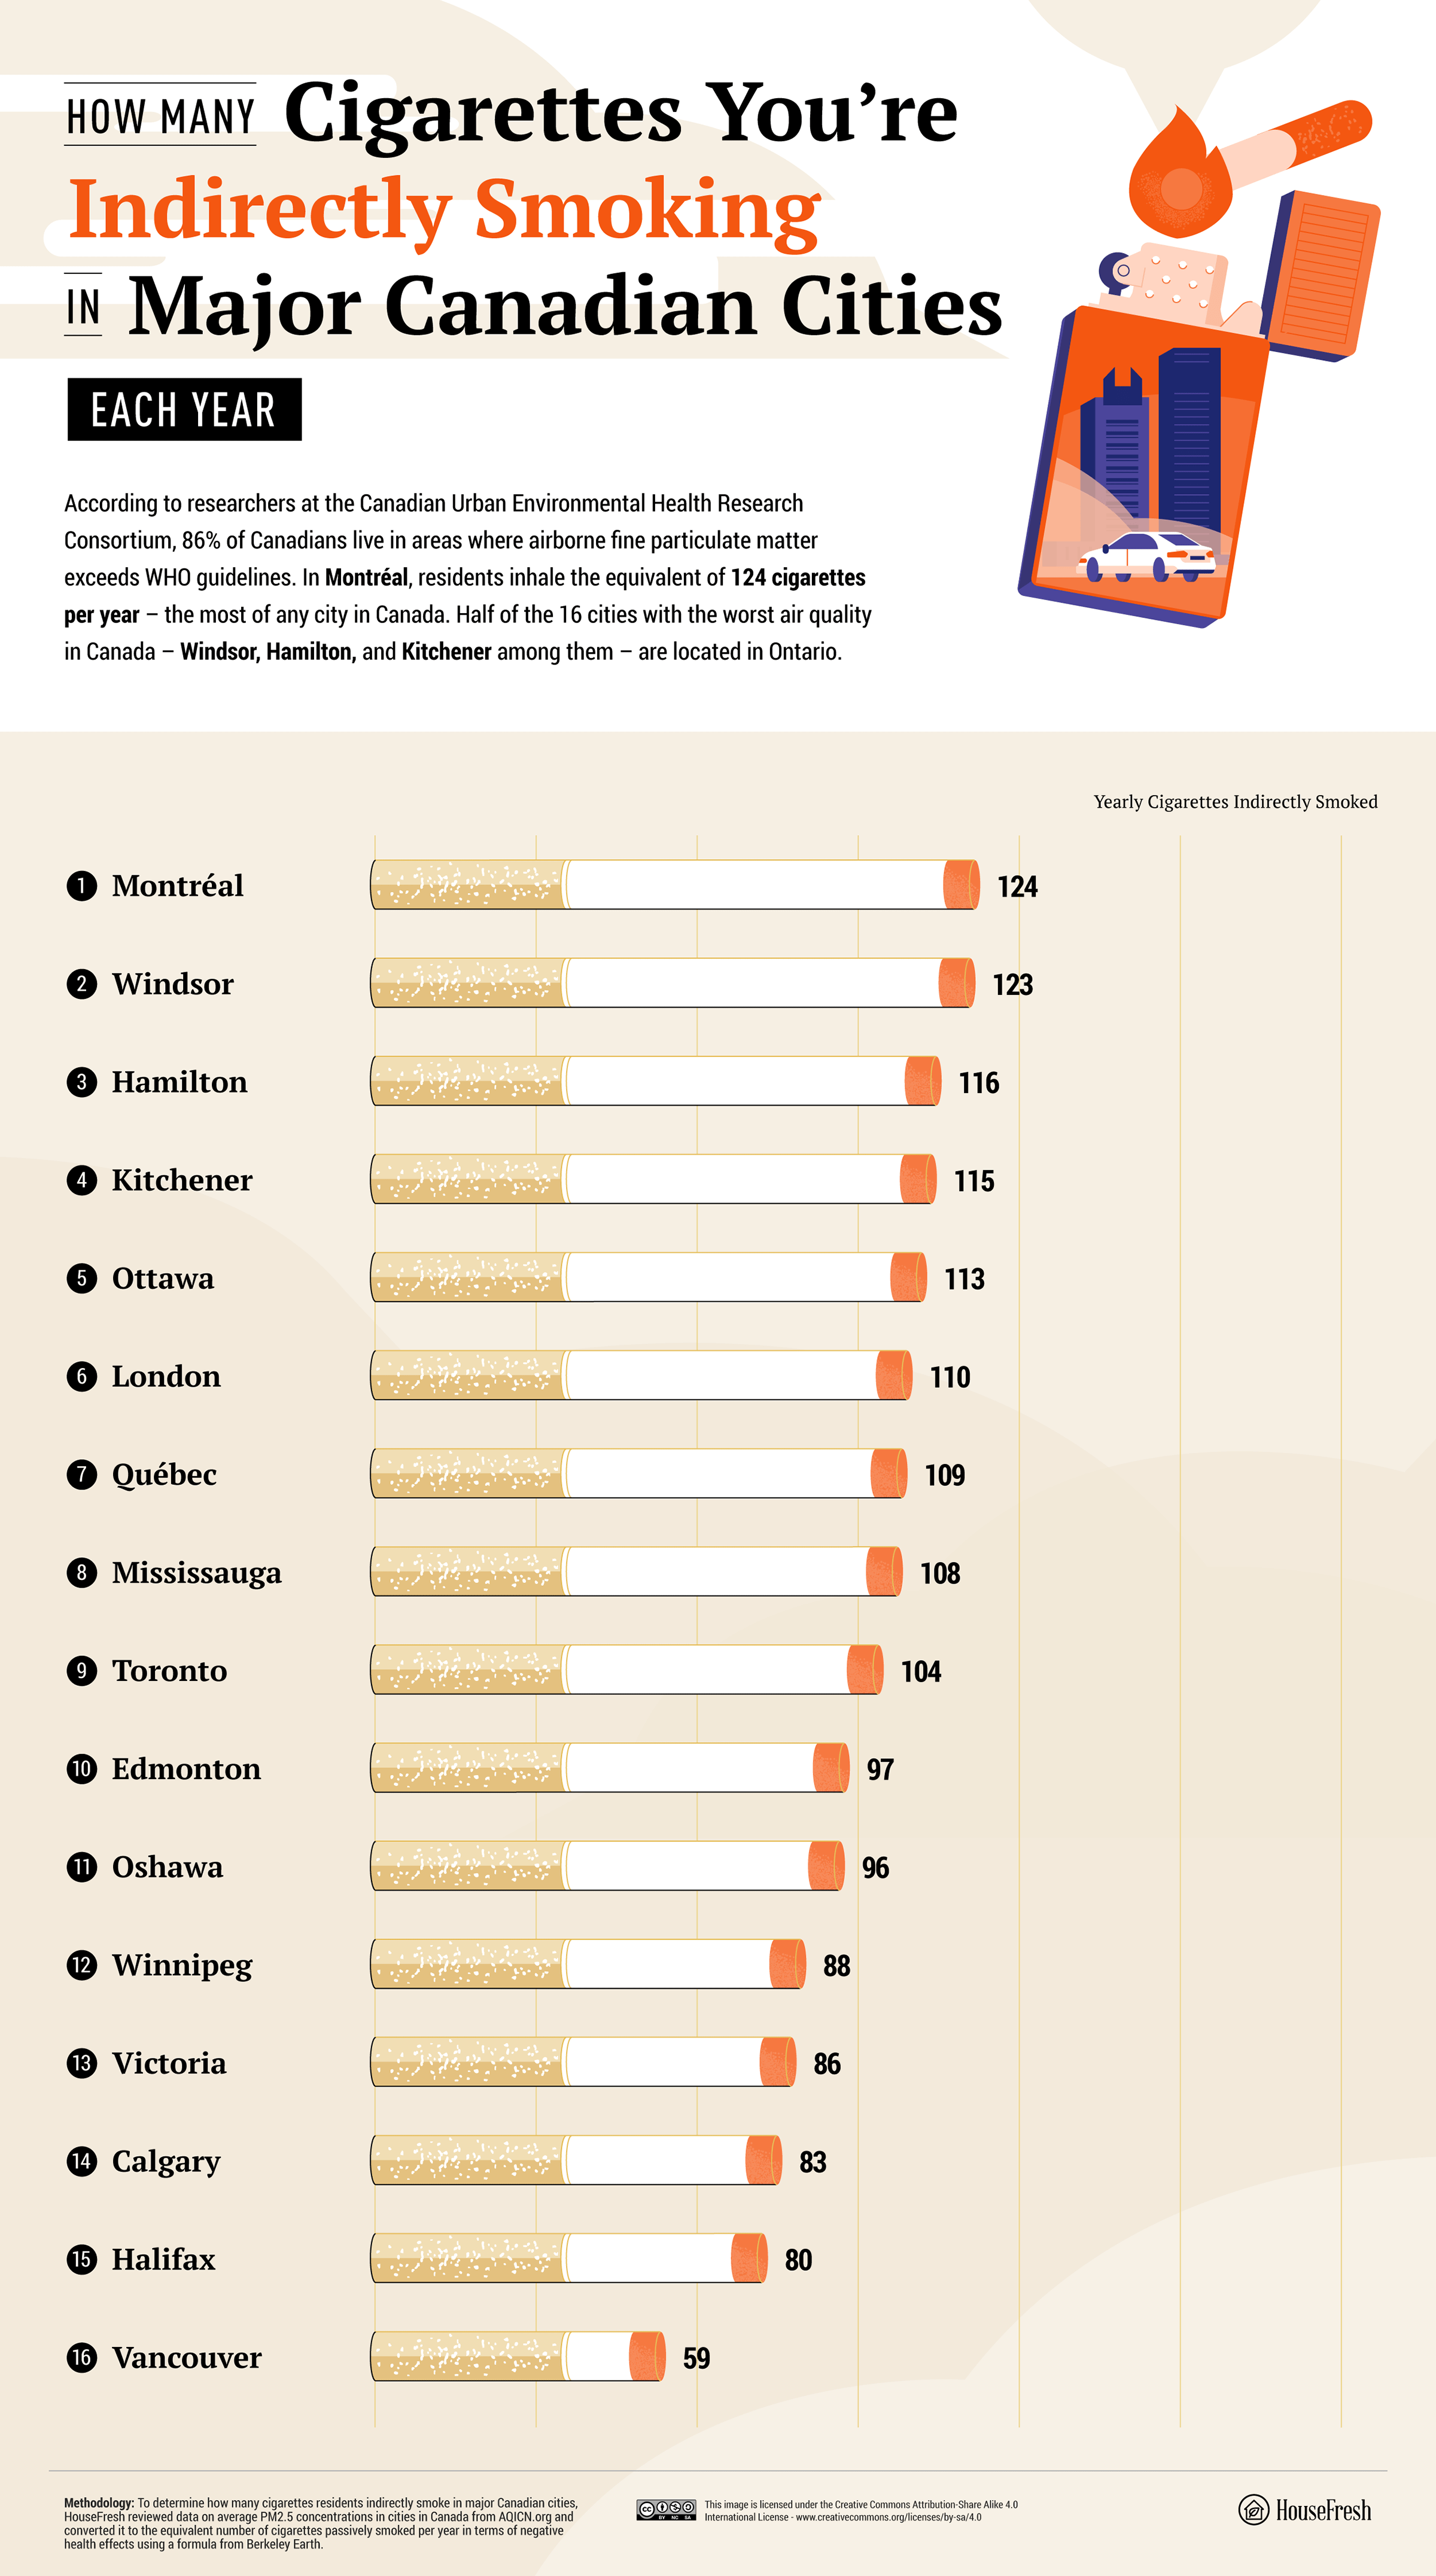
Air quality varies significantly around the globe, and in many parts of the world, the negative health effects of poor air quality are equivalent to smoking hundreds of cigarettes a year. To better communicate the health risks of air pollution, HouseFresh calculated the number of cigarettes people around the world are indirectly smoking due to poor air quality.
Methodology
To determine the number of cigarettes people around the world are indirectly smoking due to poor air quality, HouseFresh reviewed data on median PM2.5 concentrations in cities worldwide from AQICN.org and converted it to the equivalent number of cigarettes passively smoked per year in terms of negative health effects using a formula from Berkeley Earth. AQICN.org presents data from cities around the world where different air quality measurements are taken. One of the main air pollutants measured is PM2.5, or particles smaller than 2.5 microns. Berkeley's Earth describes a rule-of-thumb that compares exposure to PM2.5 particles to cigarettes smoked: one cigarette per day is the rough equivalent of a PM2.5 level of 22 µg/m3. With this equivalence in mind, the HouseFresh team collected AQI PM2.5 data from 2022 for each country's capital city and converted the index to PM2.5 concentration. Then they repeated the process for major cities in the US, UK, Australia, and Canada. Each city data comes either from aqicn.org's COVID-19 dataset (which compiles the daily median air pollutant levels based on various air quality stations in each city) or from the most centrical air quality station available. The team discarded cities where the closest air quality station was outside of the city or metropolitan area. Also, stations with few registries for 2022 were discarded. We took the average daily median AQI PM2.5 during 2022 as the average AQI PM2.5 in the city. We converted that value to cigarettes as per Berkeley's Earth rule-of-thumb and multiplied the result by 365 to obtain how many cigarettes you've indirectly smoked during a year.
Key Findings
- Many of the cities with the worst air quality are in developing economies in the Middle
East, Southeast Asia, and Africa.
- Dhaka, Bangladesh, has the worst air pollution of any capital city.
- Bern, Switzerland, has the cleanest air of any capital city in the world.
- In California, air pollution due to wildfires and vehicle emissions can offset the positive
health effects of low smoking incidence.


This post may contain affiliate links. As an Amazon Associate, I earn from qualifying purchases.
Comments
Post a Comment