The demand for energy is growing across many countries as people get richer and populations increase. But how much energy from fossil fuels, nuclear power, and renewable sources do countries across the world produce? This new study from 911Metallurgist analyzed 40 years of data from the U.S. Energy Information Administration to uncover which countries are leading the way in energy production and consumption and which types of energy they produce or consume.
Methodology
To visualize this data, 911Metallurgist used global energy production and consumption data from the U.S. Energy Information Administration, every year from 1980 to 2019. Country population data was sourced from Worldometer. Global energy consumption is measured in British Thermal Units (BTU), defined as the amount of energy when burned required to heat one pound (or 453ml) of water by one degree Fahrenheit. Energy consumption per capita in BTU is calculated by dividing a country’s total energy consumption divided by its population total. For the energy production charts, the units were kept as Quad BTU – a measurement based on one quadrillion BTU. For the timeline charts, all nations were grouped by continent except for the top 10 energy producers of that type based on 2019 figures. The data was gathered in March 2022.
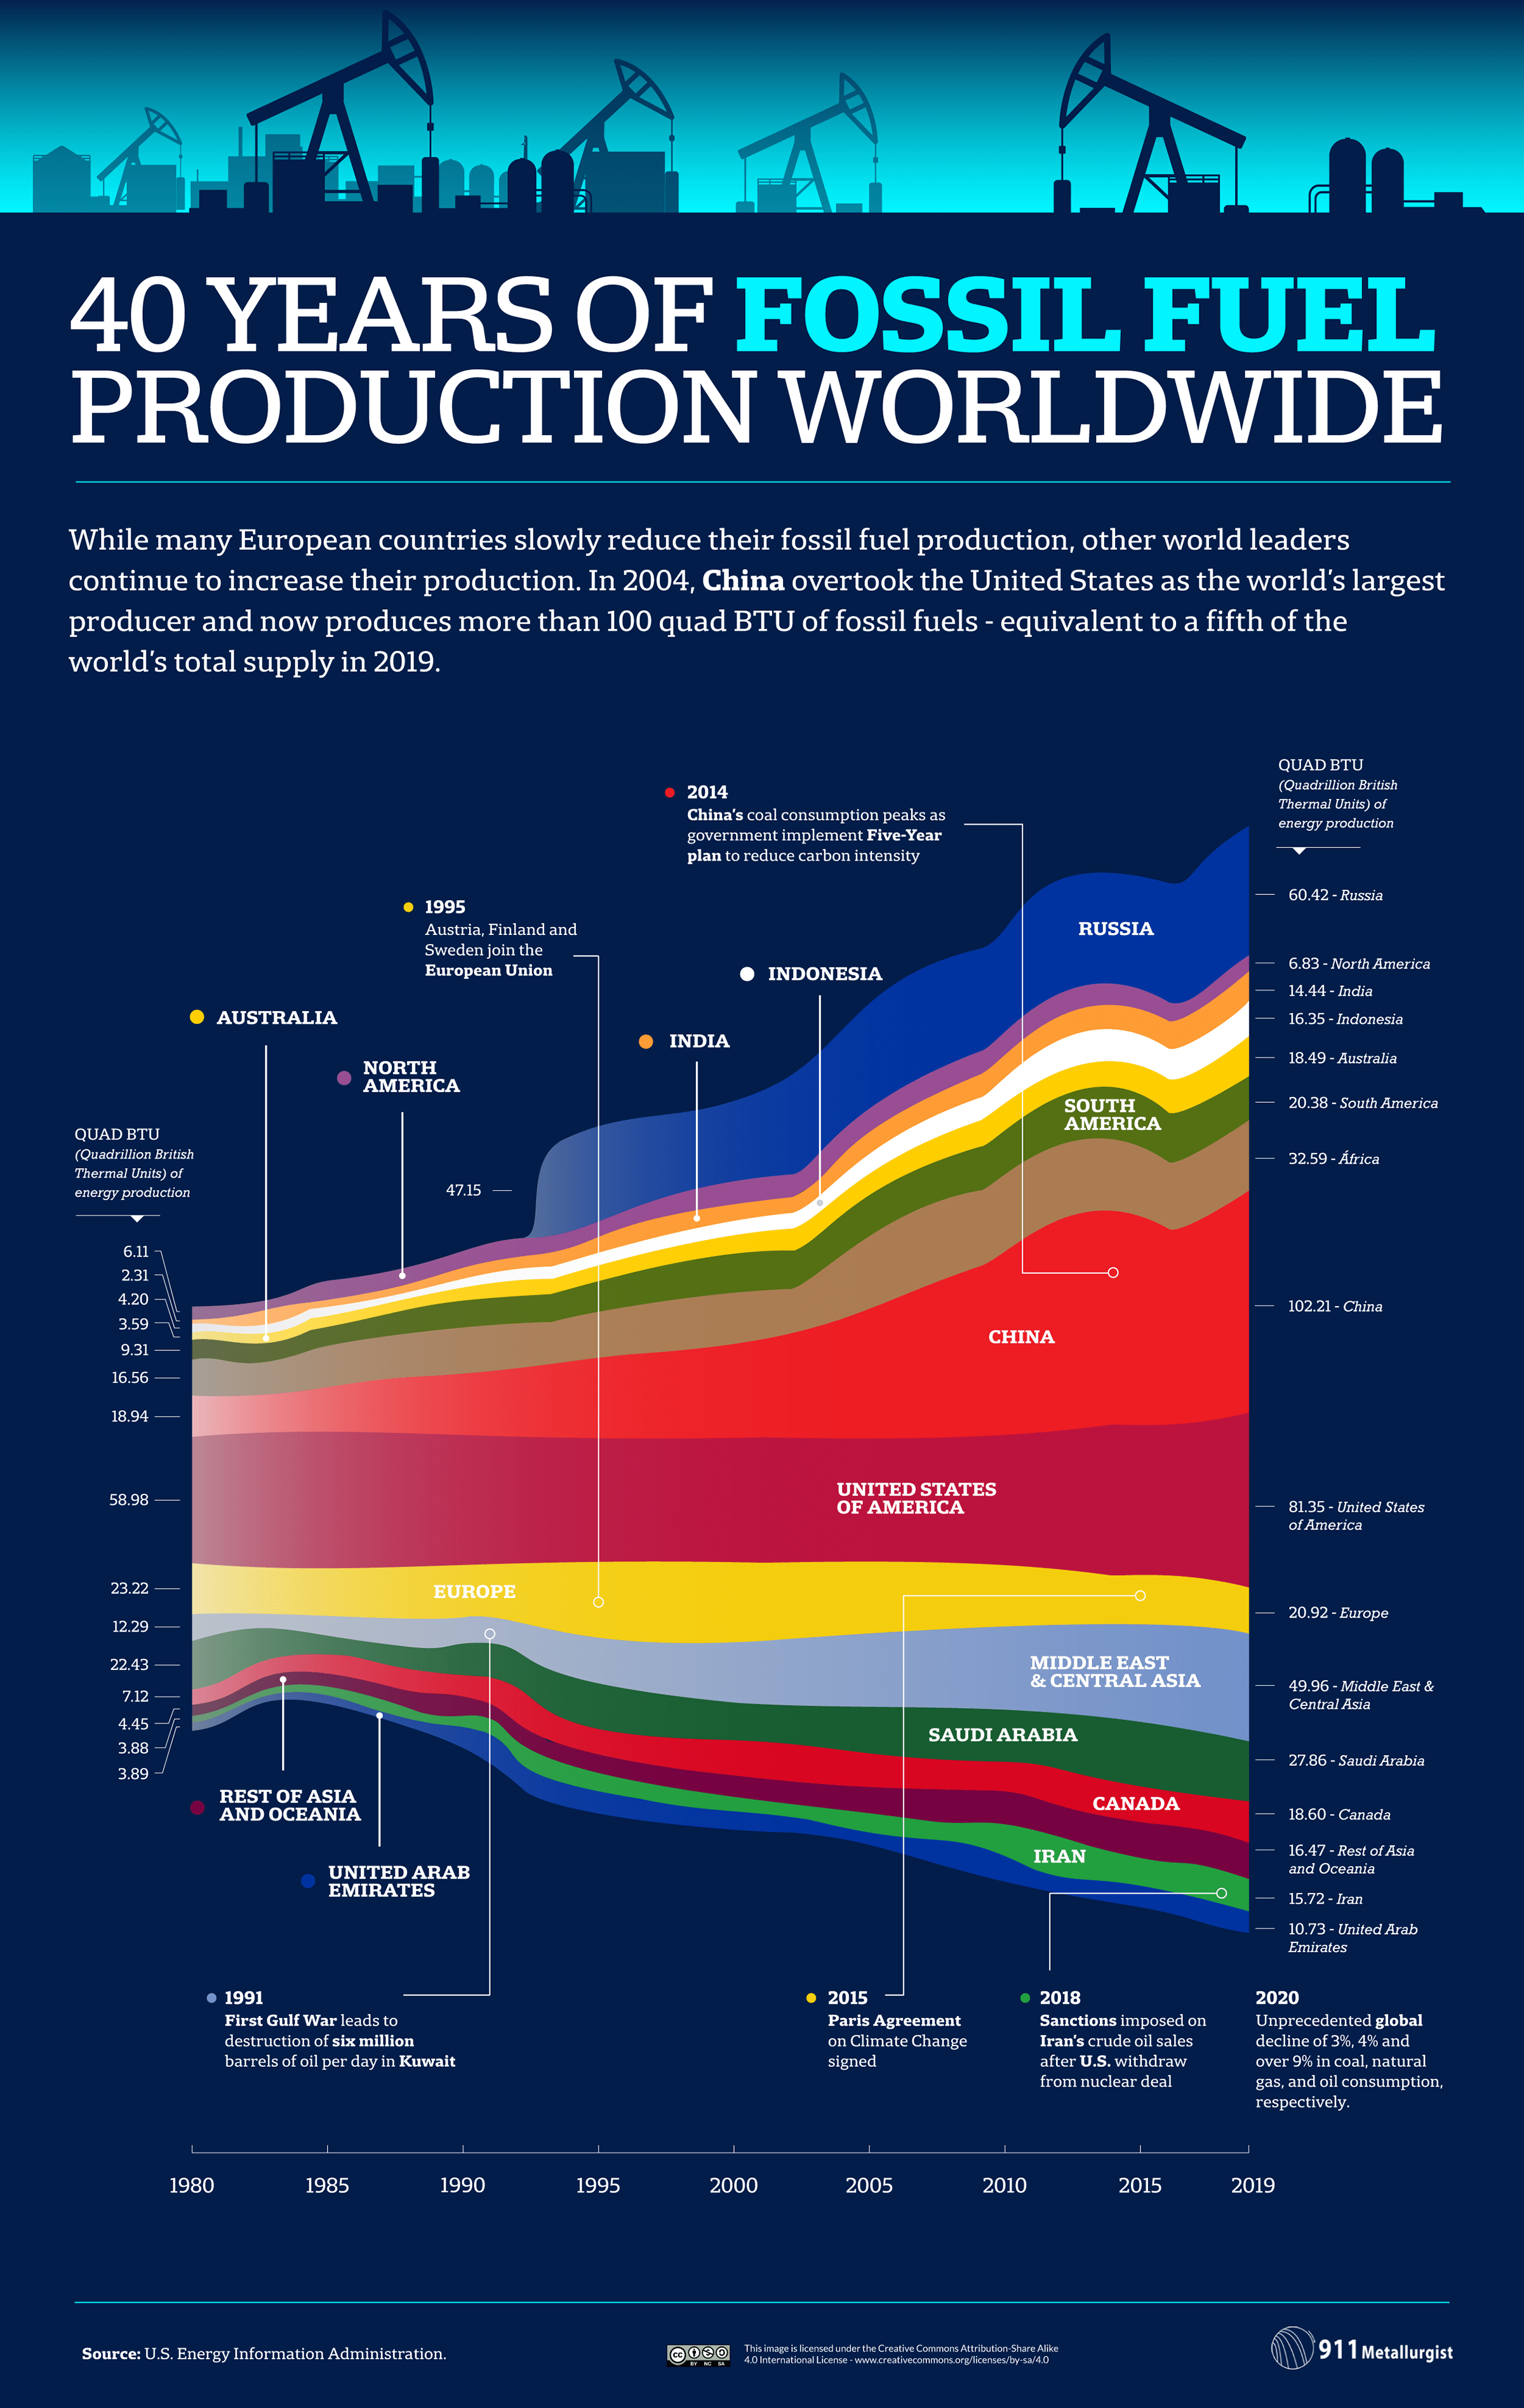
40 years of fossil fuel production worldwide
While many European countries slowly reduce their fossil fuel production, other world leaders continue to increase their production. In 2004, China othertook the U.S. as the world’s largest producer and now produces mot than 100 Quadrillion British Thermal Unites of fossil fuels - equivalent to a fifth of the world’s total supply in 2019.
40 years of nuclear power production in every country
The U.S. leads the way in the production of nuclear power, generating more than twice the amount of second-placed France. In the last decade, China has emerged as the third-largest nuclear energy producer as a way of decreasing its reliance on fossil fuels. Following the Fukushima disaster of 2011, Japan decommissioned most of its nuclear reactors, only recently pledging to restart them in order to meet their Paris Accord obligations.
40 years of renewable energy production in every country
China and the U.S. are world leaders in renewable energy production, with China overtaking the U.S. as the leading producer in 2012. Globally, renewables account for around a quarter (23%) of electricity production, according to the IEA. Europe is another significant green energy producer, with 37.5% of its electricity sourced from renewables, according to the latest EU figures.
40 years of fossil fuels vs. renewable energy production worldwide
The data shows that since 1980, global renewable energy consumption has increased almost fourfold, with usage now twice the amount (70.41 Quadrillion British Thermal Unites) it was in 2005 from when the Kyoto Protocol became effective (36.20 Quadrillion British Thermal Unites).
However, fossil fuel consumption continues to rise globally, with usage now two and a half times higher than it was in 1980. Since then, the world’s population has grown by over three billion, and emerging economies like India and China have leaned heavily on coal, oil and natural gas to meet their energy demands.


This post may contain affiliate links. As an Amazon Associate, I earn from qualifying purchases.
Comments
Post a Comment