Climate Change in Canada


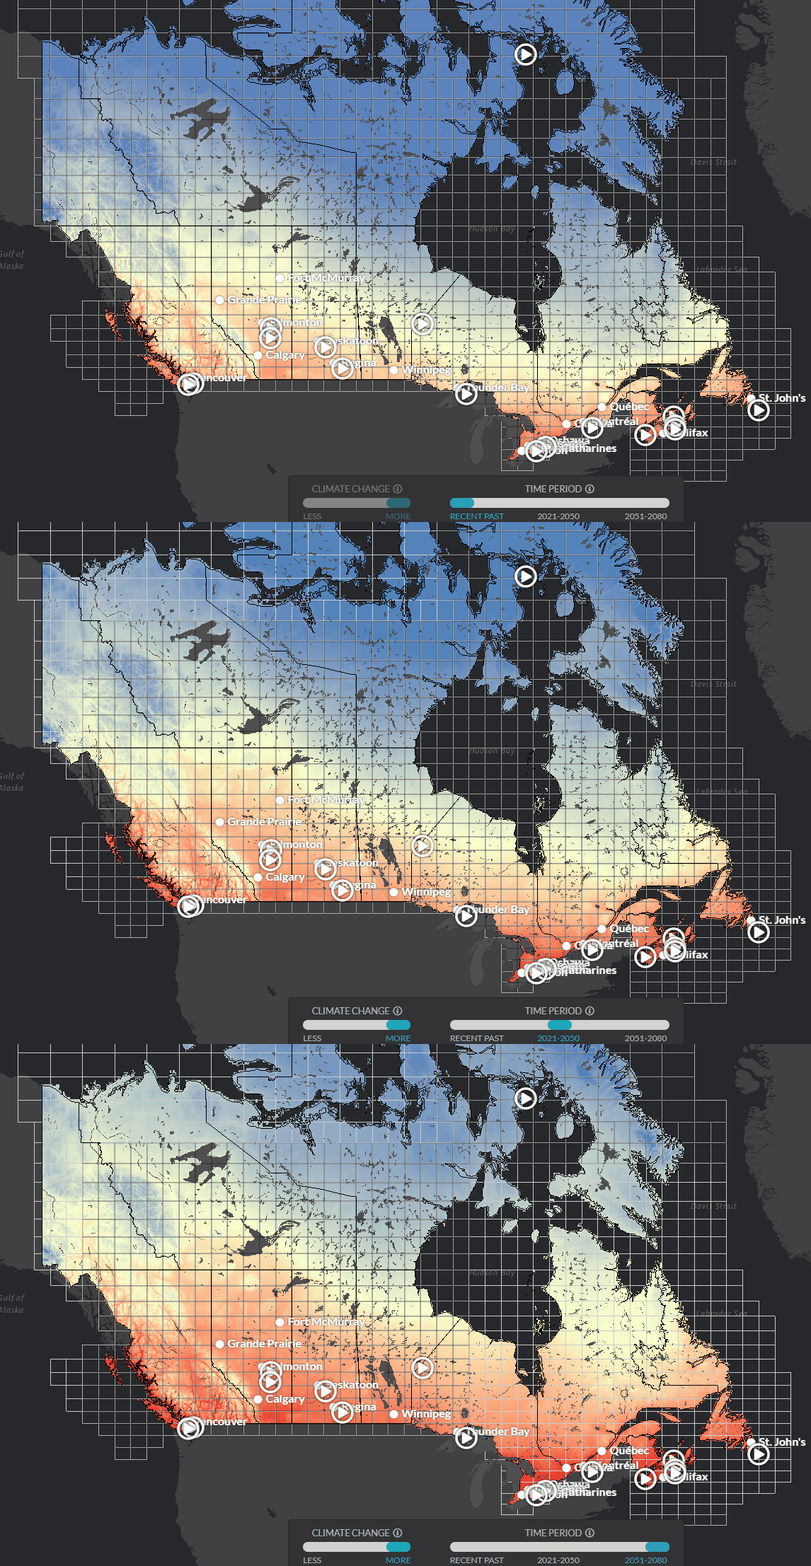
Mean Temperature
The map below shows the 30-year average of the daily mean temperature for the time period under consideration (e.g., season, year).
Mean Temperature
The temperature range we expect within a season or year is a very important aspect of climate. Changes in average and extreme temperatures can dramatically affect our everyday lives as well as a wide range of planning and policy decisions.
The average temperature is an environmental indicator with many applications in agriculture, engineering, health, energy management, recreation, and more. The average temperature is used to compute a number of other maps and indices in this Atlas.


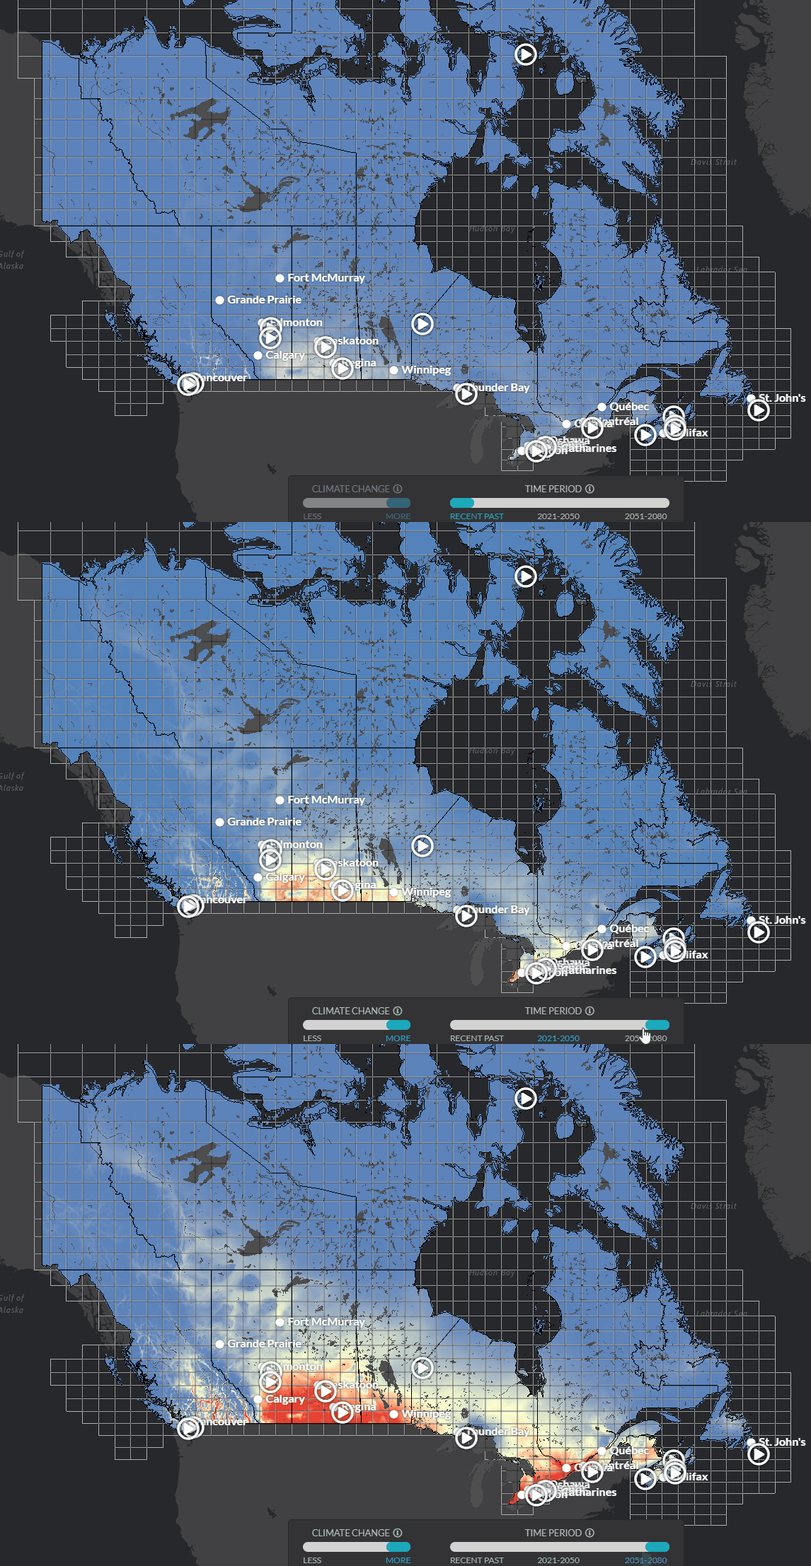
Very hot days (+30°C)
The map below shows the 30-year average of the annual number of Very Hot Days.
Very hot days (+30°C)
Very Hot Days are an indicator of summer heat.
High temperatures are important. They determine if plants and animals can thrive, they limit or enable outdoor activities, define how we design our buildings and vehicles, and shape our transportation and energy use. It is useful to know how high summer temperatures are likely to become in the future, to make sure that our cooling and air-conditioning systems can reliably deal with these extremes.
When temperatures are very hot, people - especially the elderly - are much more likely to suffer from heat exhaustion and heat stroke. Many outdoor activities become dangerous or impossible in very high temperatures. In general, Canadians are not used to extremely hot summers, and further warming will bring new and unusual risks as well as a very different experience of the summer season.
High, persistent temperatures increase the risk of drought, which can severely impact food production and increases the risk of wildfire. High temperatures can also lead to more thunderstorms, which means increased risks of flash flooding, lightning, hail and perhaps even tornadoes.


Frost-free season
The map below shows the 30-year average of the number of days between the Date of Last Spring Frost and the Date of First Fall Frost.
Frost-free season
Changes in the length and timing of the Frost-Free Season affect plant and animal life, but also our social, psychological, and physical experience of the changing seasons.
The average length of the growing season (and its year-to-year variability) is an important consideration when selecting or predicting what plants might grow well in a region. A longer Frost-Free Season means plants and crops have a longer window to grow and mature.
If projections show an increase in the length of the Frost-Free Season, then the annual growing season will be longer, and the period of cold weather correspondingly shorter.


Via www.climateatlas.ca
This post may contain affiliate links. As an Amazon Associate, I earn from qualifying purchases.


Popular posts from this blog

Find cities with similar climate

This map has been created using The Global environmental stratification. The Global environmental stratification (GEnS), based on statistical clustering of bioclimate data (WorldClim). GEnS, consists of 125 strata, which have been aggregated into 18 global environmental zones (labeled A to R) based on the dendrogram. Interactive map >> Via www.vividmaps.com Related posts: -  Find cities with similar climate 2050 -  How global warming will impact 6000+ cities around the world?

Moose population in North America

The moose ( Alces alces ) is the largest member of the deer family, characterized by its massive size, long legs, and distinctive broad, palmate antlers found in males. They have a dark brown or black coat and a humped shoulder. Moose are primarily found in the boreal and mixed deciduous forests of North America, Europe, and Asia. They are solitary animals, often found near bodies of water, and are herbivores that feed on leaves, bark, twigs, and aquatic vegetation. Despite their size, moose are strong swimmers and can run up to 35 miles per hour. The moose population in North America is shrinking swiftly. This decrease has been correlated to the opening of roadways and landscapes into this animal's north range.   In North America, the moose range includes almost all of Canada and Alaska, the northern part of New England and New York, the upper Rocky Mountains, northern Minnesota and Wisconsin, Michigan's Upper Peninsula, and Isle Royale.    In 2014-2015, the North Americ...

Map of Fox Species Distribution

Foxes are small to medium-sized members of the Canidae family, which also includes wolves, dogs, and other related animals. There are about 37 species of foxes distributed around the world, and they inhabit a wide range of environments, from forests and grasslands to deserts and urban areas. Below is the map of fox species distribution  created by Reddit user isaacSW Here are some of the most well-known fox species and their distribution: Red Fox ( Vulpes vulpes ): The red fox is one of the most widely distributed fox species and is found in North America, Europe, Asia, and parts of North Africa. They are adaptable and can live in a variety of habitats, including forests, grasslands, and urban areas. Arctic Fox ( Vulpes lagopus ): The Arctic fox is found in the Arctic regions of North America, Europe, and Asia. They have adaptations that help them survive in cold climates, such as a thick coat that changes color with the seasons. Gray Fox ( Urocyon cinereoargenteus ): The gray ...